Alopecia Severity Endpoints for Clinical Trials
The AI scoring provided by Legit.Health delivers automated, standardised alopecia severity scoring for clinical trials, measuring scalp hair loss in each of the four SALT quadrants from standardised photographs to compute the Severity of Alopecia Tool (SALT) score, the standard measure of the extent of scalp hair loss in alopecia areata trials.
The device supports interventional and observational studies across all clinical trial phases, from Phase I to Phase IV, as well as real-world evidence (RWE) and post-marketing studies.
Severity of Alopecia Tool
0 to 100 scale, four weighted scalp quadrants
Images analysed
4 (top, back, left and right)
Analysis performed in
1.2 seconds
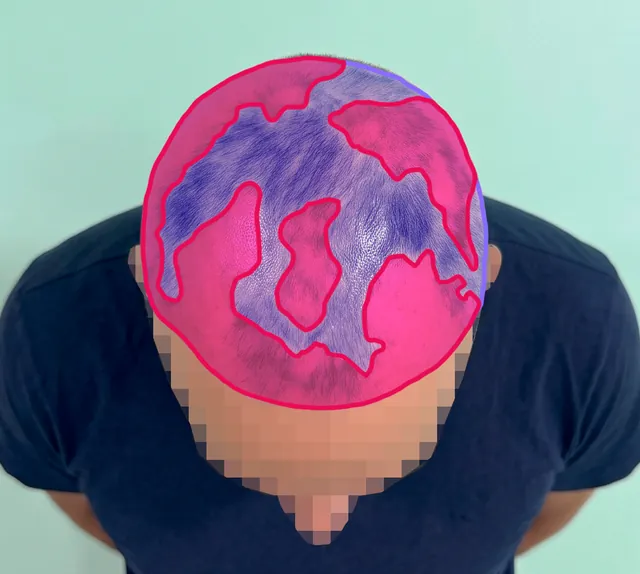
Body site
Top
Image quality
63%
Hair loss
62%
SevereSALT points
25
40% of the scalp
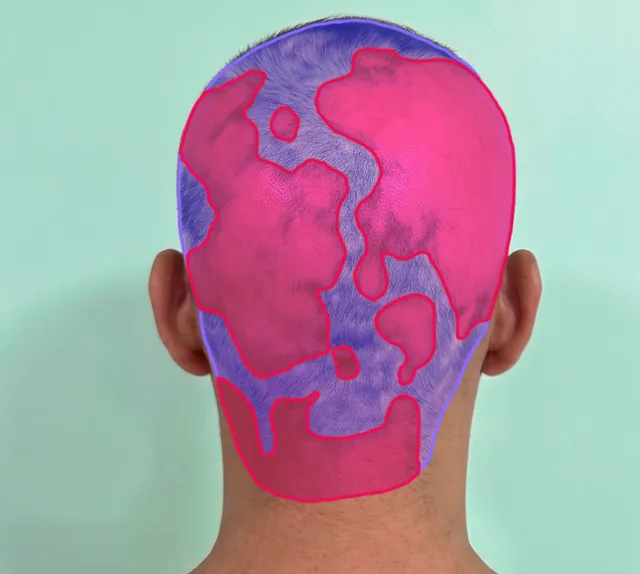
Body site
Back
Image quality
55%
Hair loss
70%
SevereSALT points
17
24% of the scalp
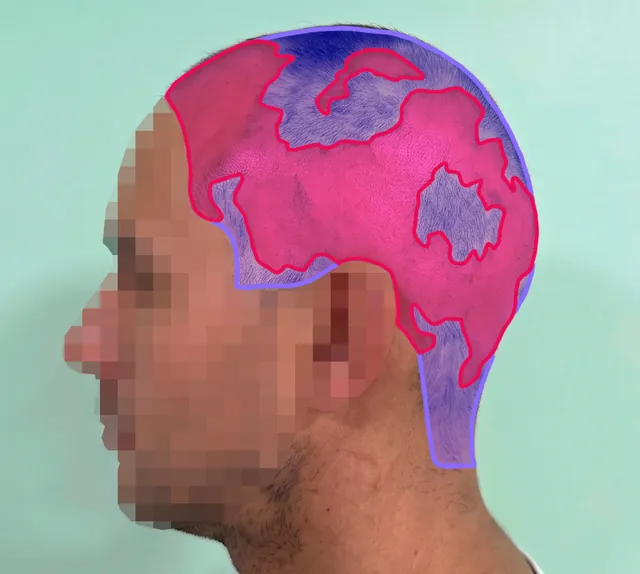
Body site
Left side
Image quality
68%
Hair loss
66%
SevereSALT points
12
18% of the scalp
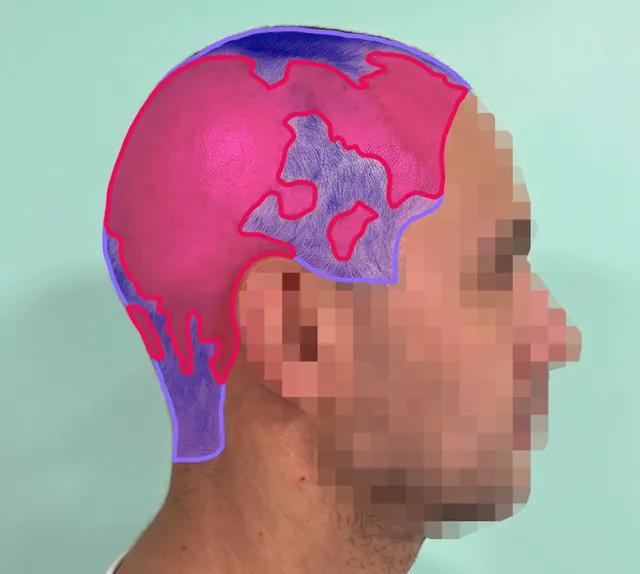
Body site
Right side
Image quality
66%
Hair loss
68%
SevereSALT points
12
18% of the scalp
The validation of the model behind these scores is on Clinical evidence.
The example images on this page are synthetic dermatology imagery used for illustration; they are not patient records.
Why automated SALT scoring for clinical trials?
Manual SALT asks a rater to estimate by eye the percentage of hair loss in each of four scalp quadrants, four separate judgements per patient per visit, usually made in coarse steps. Estimating that percentage is the most operator-dependent step of the score, and two raters looking at the same scalp often land on different values.
The AI automates every component of the score:
- Hair loss measurement: pixel-level segmentation of hair, hair loss and non-scalp in each of the four quadrant photographs, replacing visual estimation
- SALT calculation: the four quadrant percentages combined with the standard SALT weights into the total score, from 0 to 100
- DIQA (Dermatology Image Quality Assessment): image quality assessed before scoring, so substandard images are flagged for recapture at the visit rather than surfacing as missing data at database lock
The four photographs follow a standardised capture protocol, so every visit is photographed the same way; see Imaging protocol.
Automated SALT returns a continuous measurement from standardised photographs, with three properties manual scoring cannot offer:
- Perfect reproducibility: the same image always produces the same score, with zero intra-rater variability, at every site and every visit.
- No investigator training drift: performance does not depend on how recently a site was trained or on which rater is on shift that day.
- Less noise in SALT change from baseline, which can support smaller sample sizes or greater statistical power to detect treatment response, once agreement with investigator scoring is confirmed.
Endpoint capabilities
The AI reports the SALT score and its four regional components from a single capture set, configurable per study protocol:
- Total score
- 0 to 100
- The percentage of the whole scalp without hair
- Structure
- 4 weighted quadrants
- Top 40%, back 24%, left side 18% and right side 18% of the scalp
- Regional extent
- 0 to 100% per quadrant
- Hair loss in each quadrant, measured at pixel level, not estimated
- Granularity
- Per quadrant
- Quadrant percentages feed the SALT and show where hair is lost or regrown
SALT is the efficacy measure of alopecia areata programmes, and every responder definition is read from the same score; see SALT response thresholds. The regional percentages are reported alongside, because they show which part of the scalp drives the change.
How the AI works
For each of the four photographs, a deep learning model detects the scalp and classifies every pixel of it as hair or no hair, leaving the background, the face and the ears out. It then measures the percentage of the scalp affected by hair loss in that view, and the four percentages are combined into the SALT score.
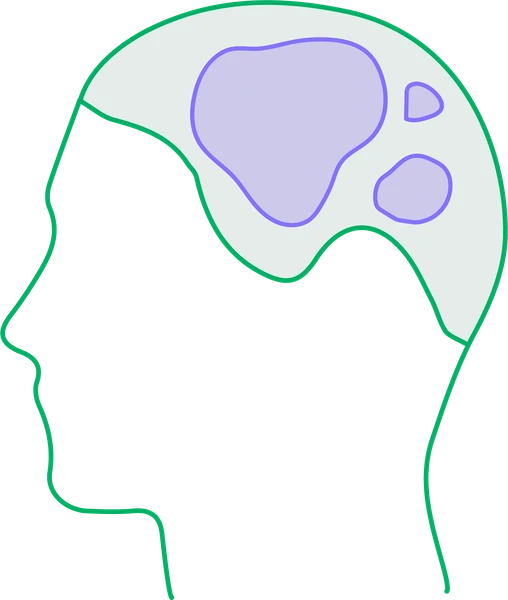
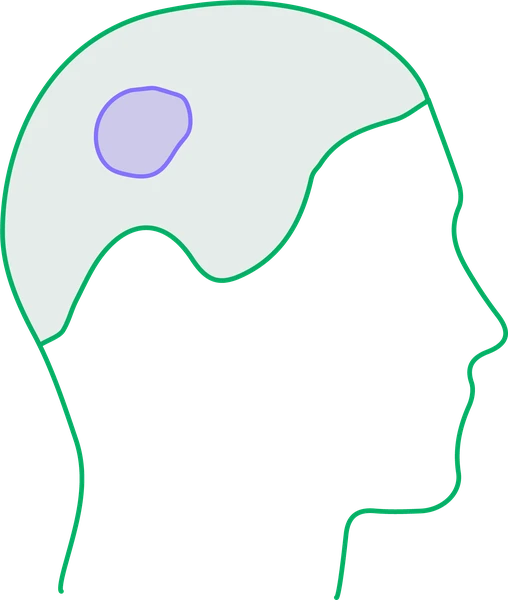
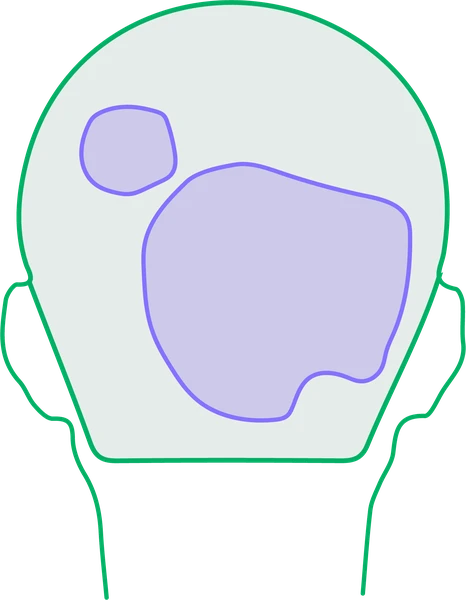
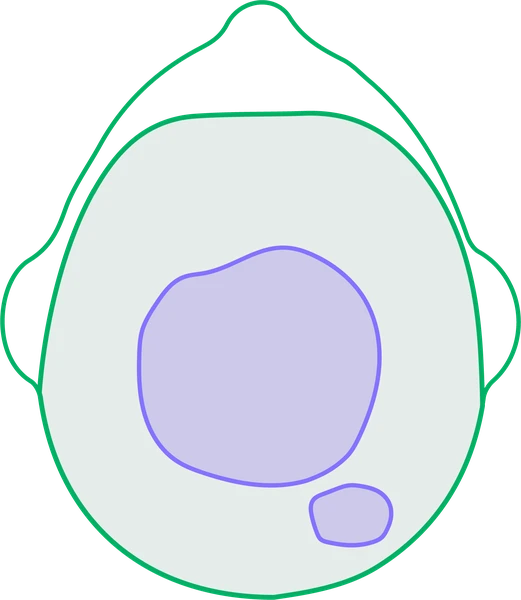
The segmentation mask appears over the original photograph, so the investigator sees exactly which areas were counted as hair loss:
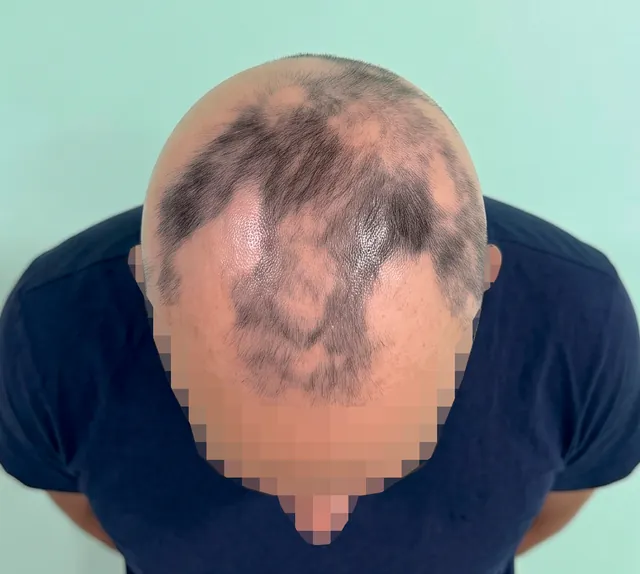
Top of the scalp
The quadrant shown in the slider
| Partial SALT | Hair loss in the quadrant | Share of the scalp |
|---|---|---|
| 25 points | 62% | 40% |
Automated analysis of a scalp: pixel-level segmentation and the SALT calculation, with illustrative values
Longitudinal severity tracking
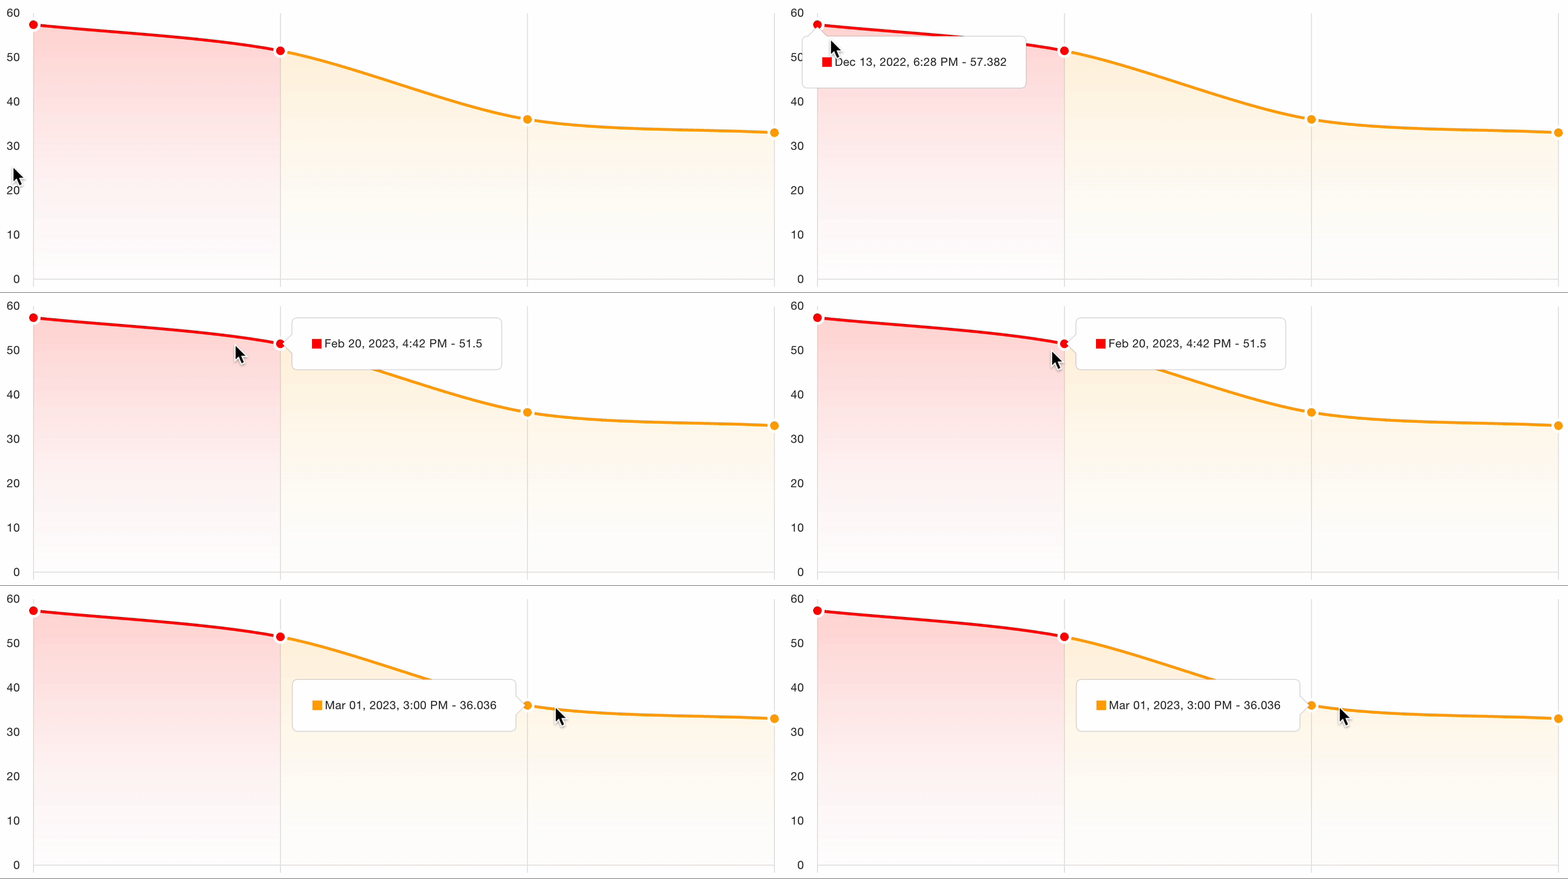
From the follow-up visits onward, the same report shows how severity evolves across the study:
- SALT trajectory: absolute and percentage change from baseline at each visit, from screening to end of study
- Responder definitions: whether the patient has reached SALT 20 or less, SALT 50, SALT 75 or SALT 90, derived from the per-visit scores
- Per-quadrant trends: which part of the scalp is driving regrowth or further loss
- Alerts against baseline: a notification to the site when hair loss increases by the configured threshold, which also supports adverse event monitoring in trials outside dermatology
- Protocol adherence: whether assessments are captured at the correct intervals
For follow-up visits, the platform charts this severity evolution across all assessments for the patient:
The platform provides automated severity scoring as decision support. Scores are interpreted by qualified healthcare professionals within the patient's overall clinical context; the platform does not replace clinical judgement or make autonomous diagnostic decisions.