Sample Outputs and Deliverables
This page shows the concrete outputs that sponsors, CROs, and investigators receive from each atopic dermatitis severity assessment. The AI generates structured ASCORAD reports immediately after image submission — no central reader, no delays.
Per-visit assessment report
Each image submission generates a complete ASCORAD report, accessible within seconds:
What the report contains
| Output | Detail |
|---|---|
| Objective SCORAD | 0–72 computed from BSA + intensity signs |
| Total SCORAD | 0–103 including patient-reported pruritus and sleep disturbance |
| BSA percentage | Per-area and global affected body surface area |
| Per-sign scores | Erythema, oedema, oozing, excoriations, lichenification, dryness (each 0–3) |
| Segmentation masks | Pixel-level eczema area masks per body region |
| Image quality (DIQA) | Quality score per image; failed images flagged for recapture |
| Severity classification | Mild (<25) / Moderate (25–50) / Severe (>50) |
| Timestamp | UTC timestamp of capture and AI processing |
AI visual outputs
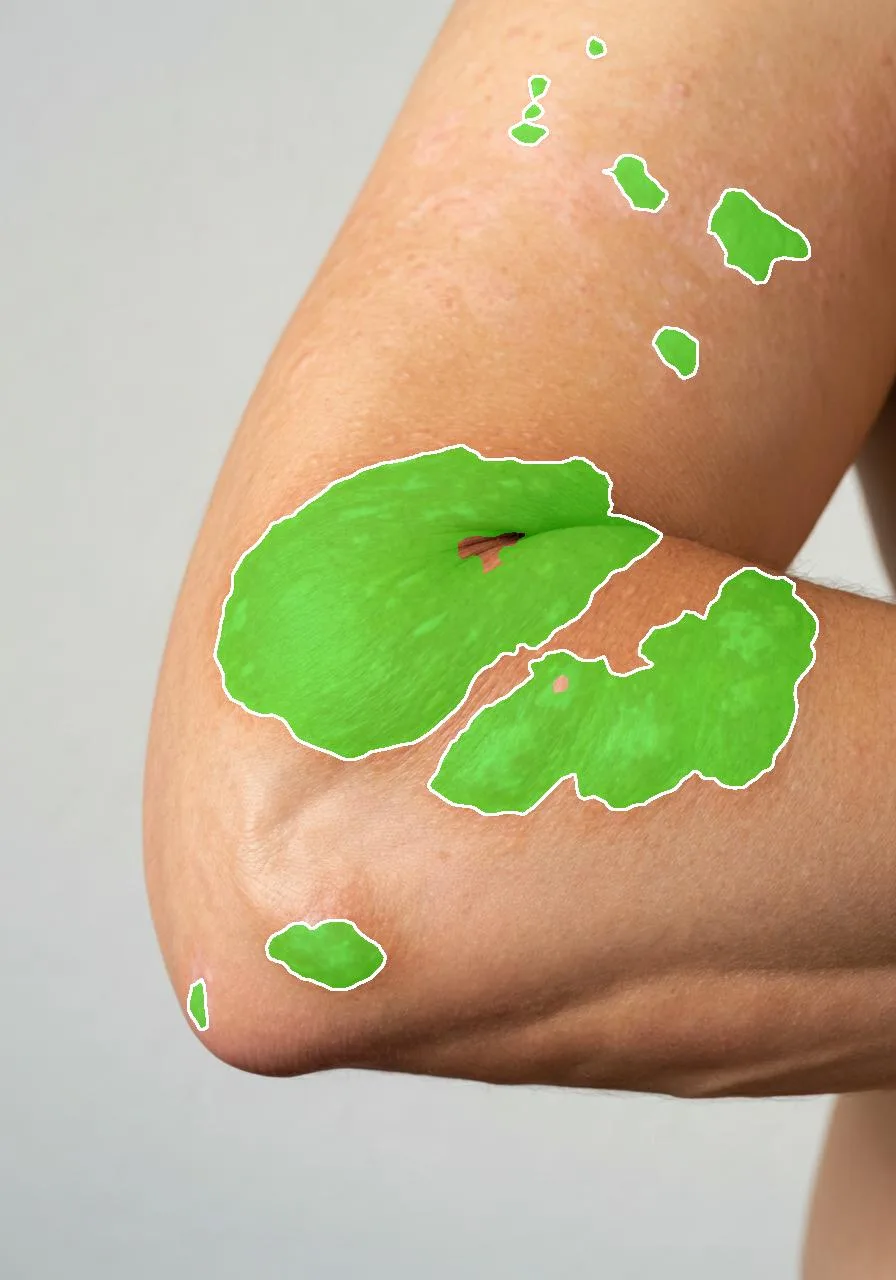
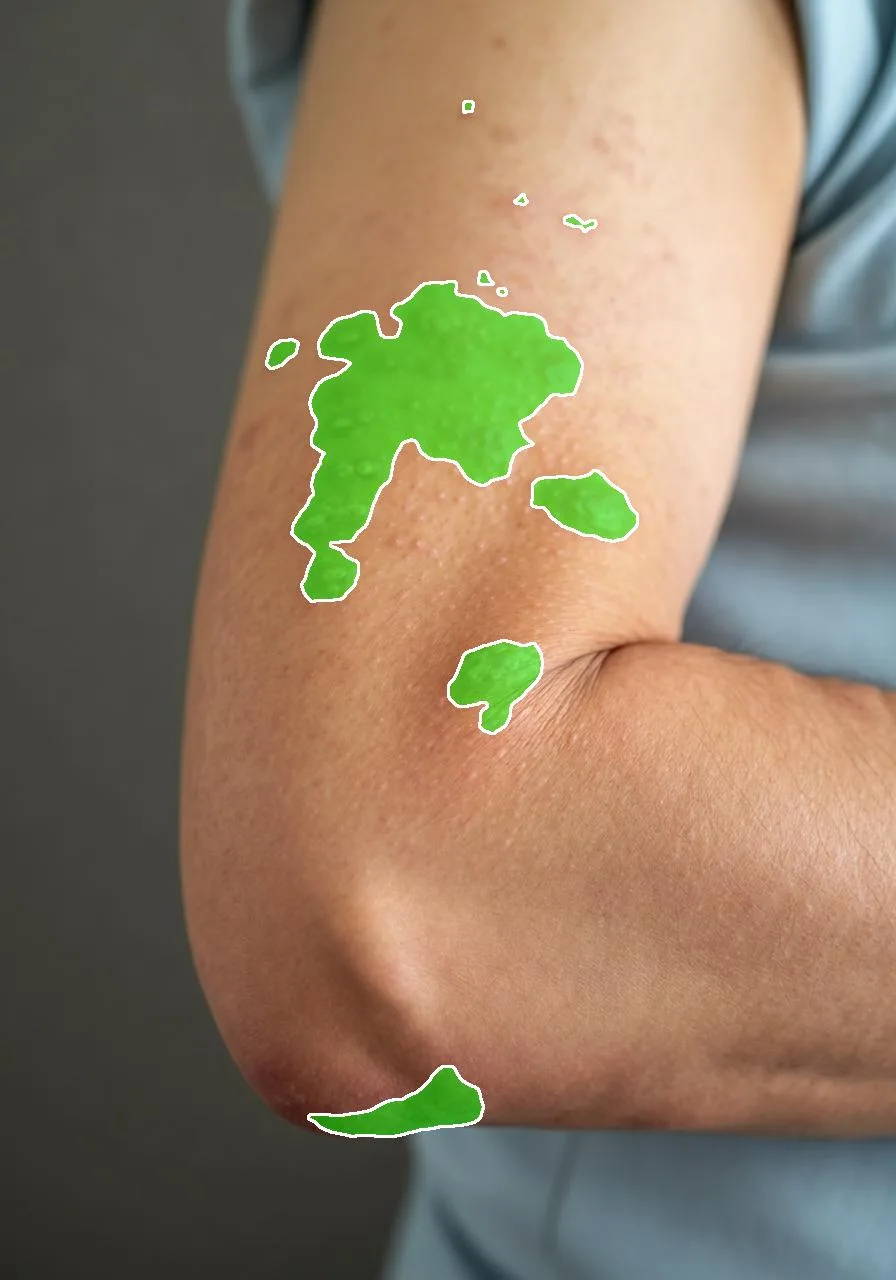
BSA segmentation masks
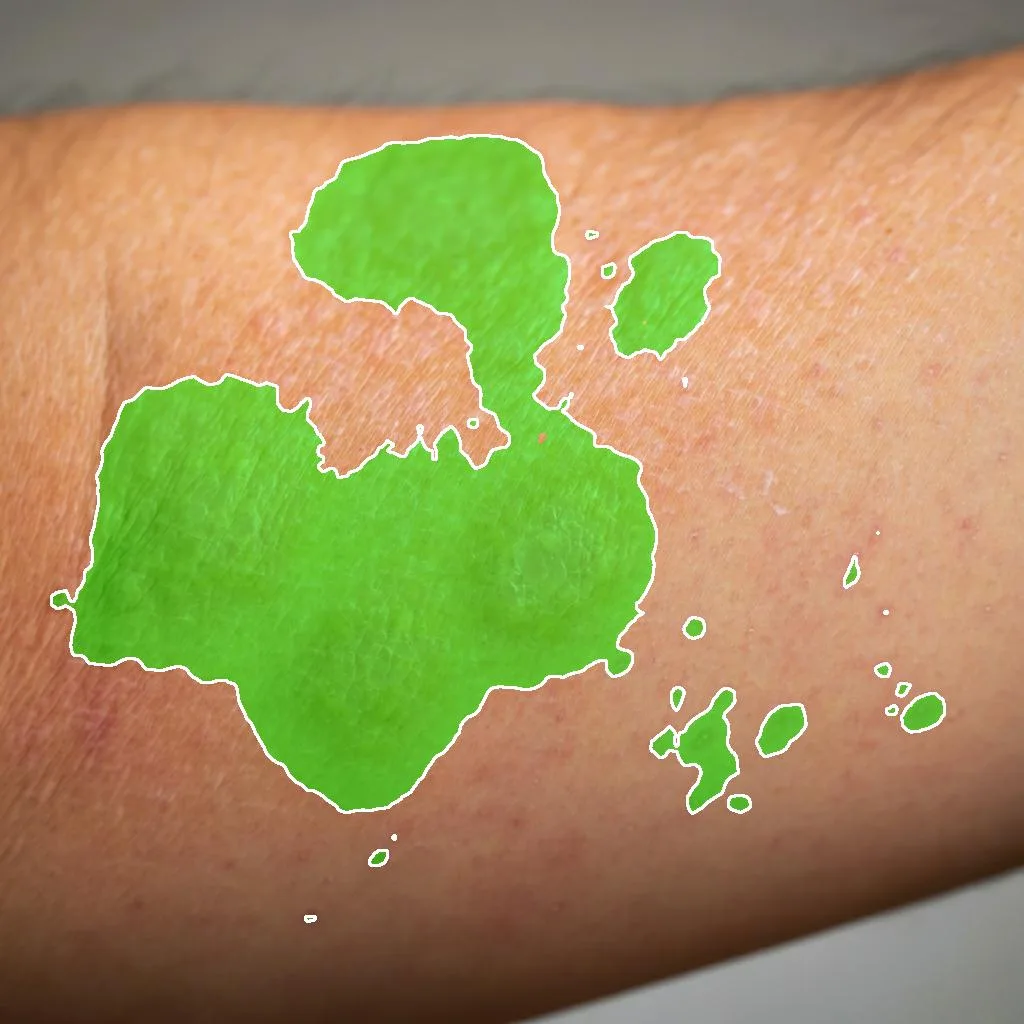
For each body area, the AI generates a pixel-level segmentation mask showing exactly which skin areas are classified as affected by eczema.
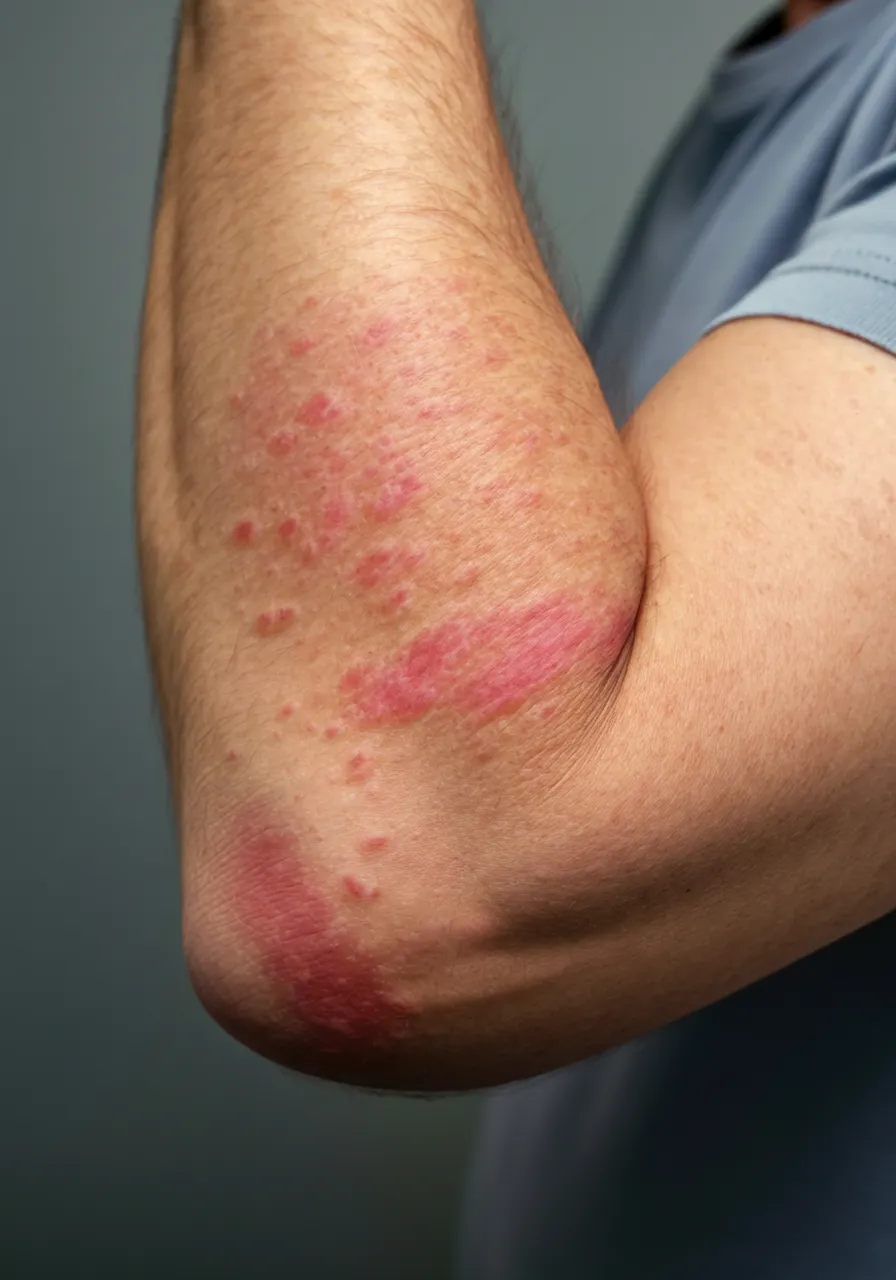
Input: body area photograph
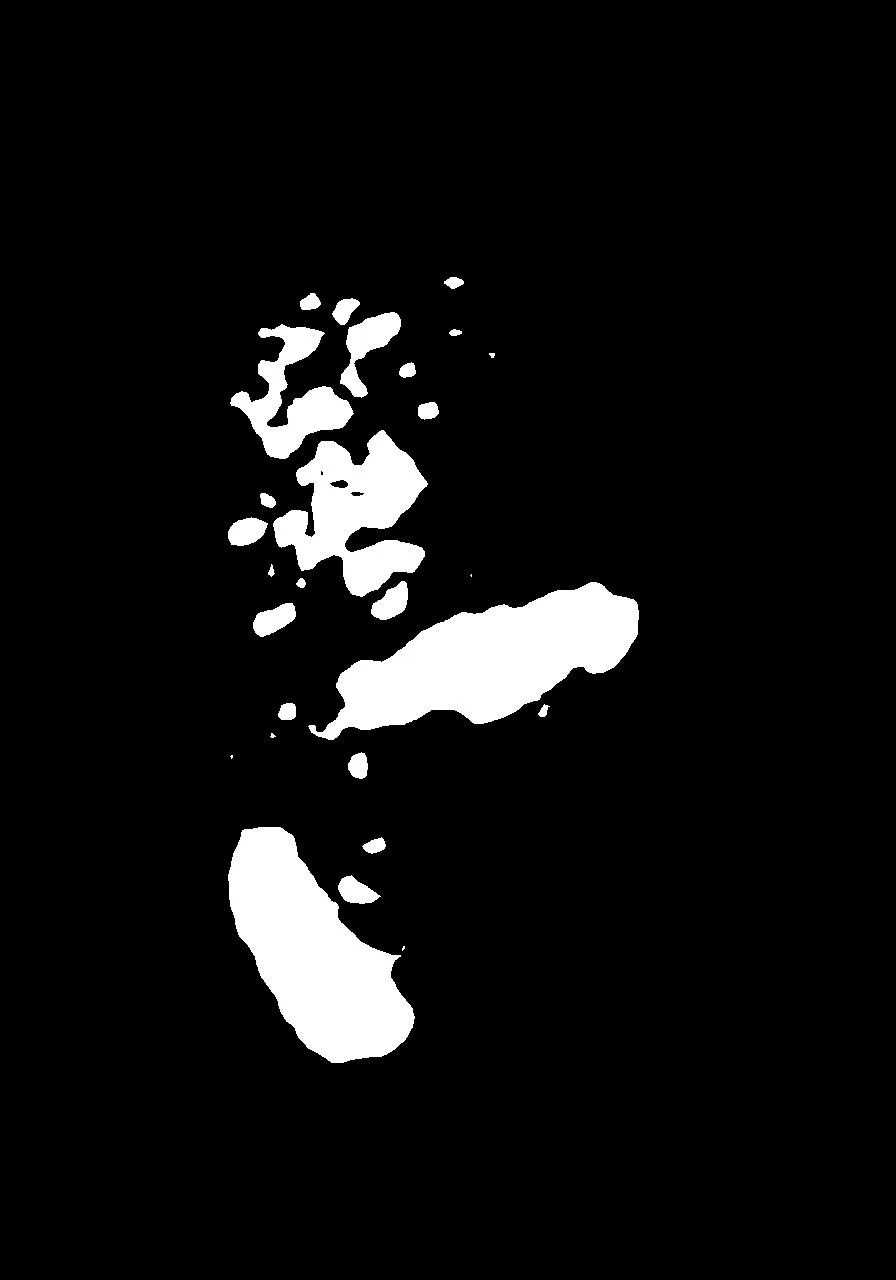
Output: affected area at pixel level
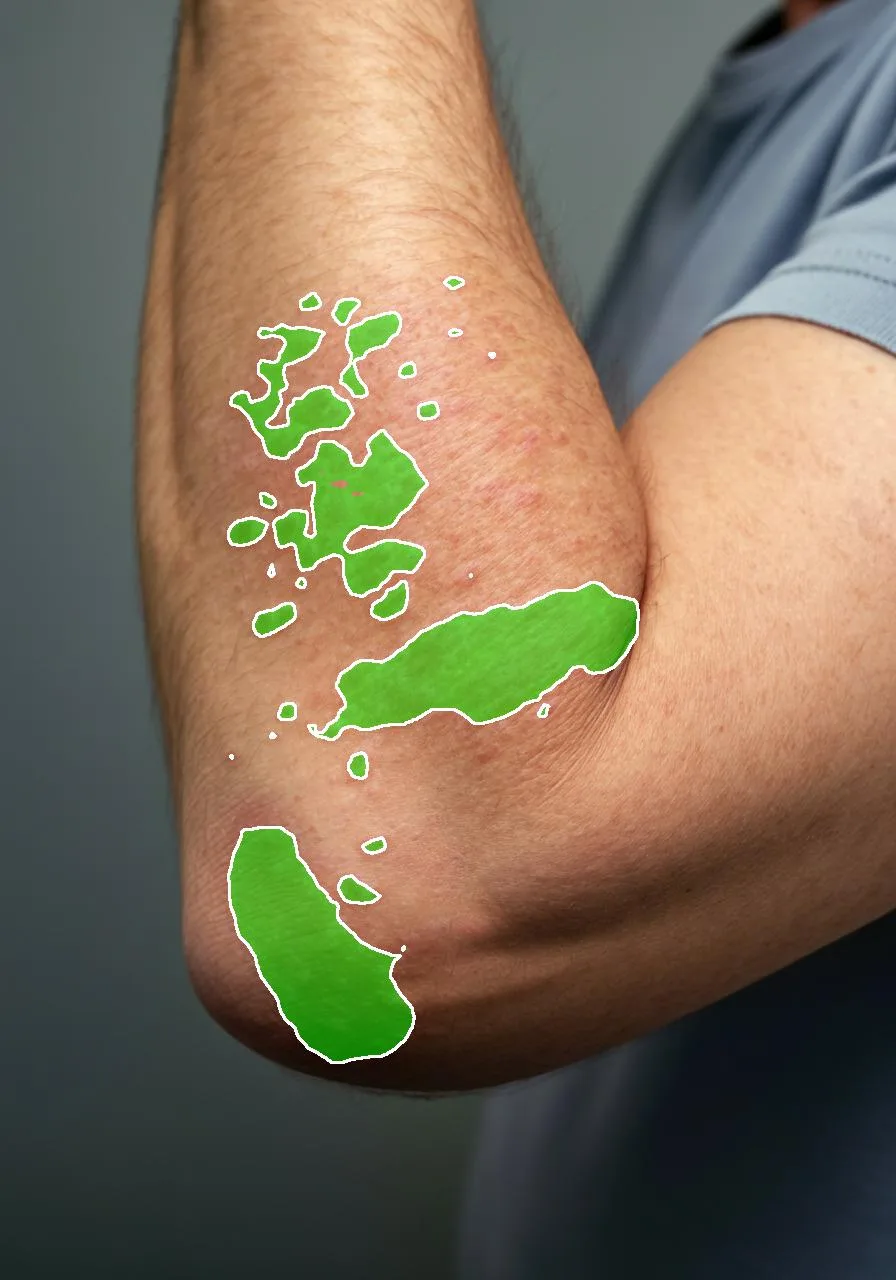
Combined: segmentation overlaid on photograph
Per-sign intensity visualisations
Each of the six SCORAD intensity signs is scored and visualised independently:
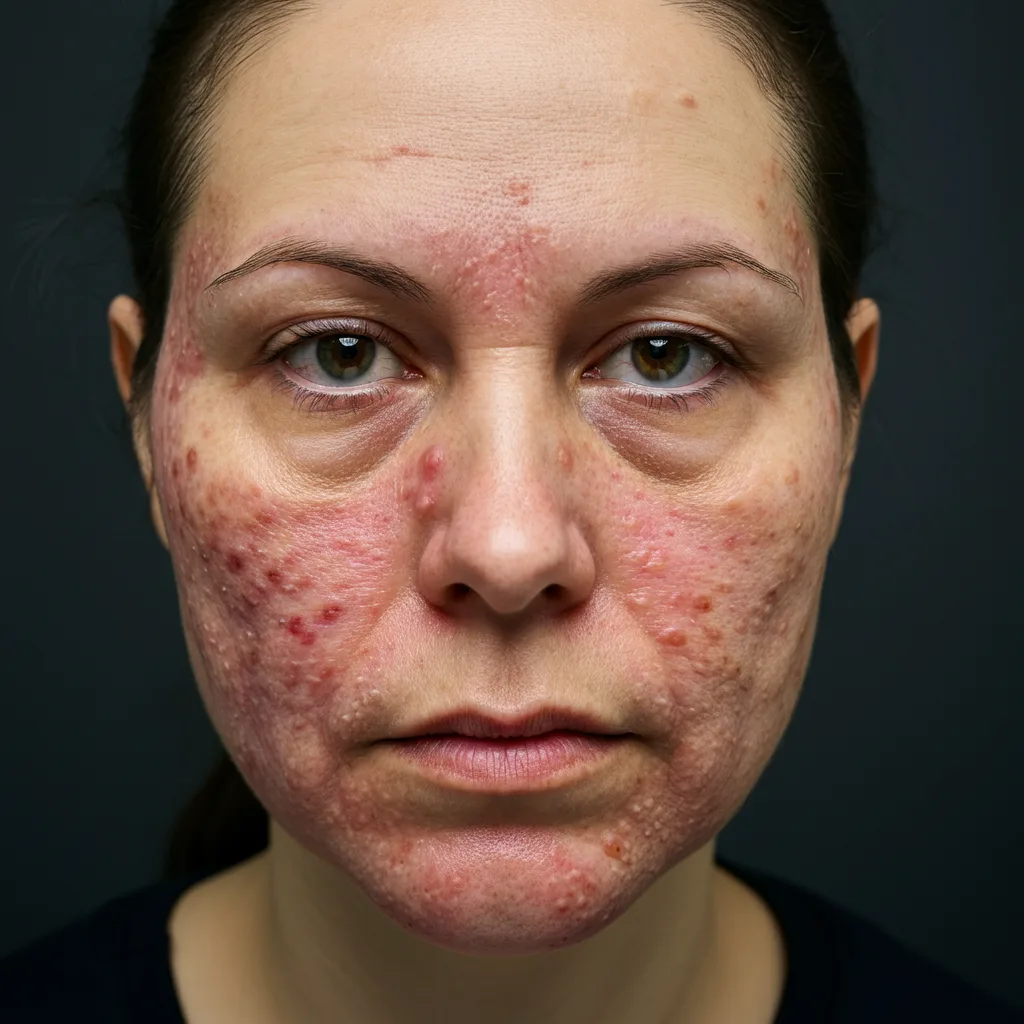
Erythema (redness) heat map
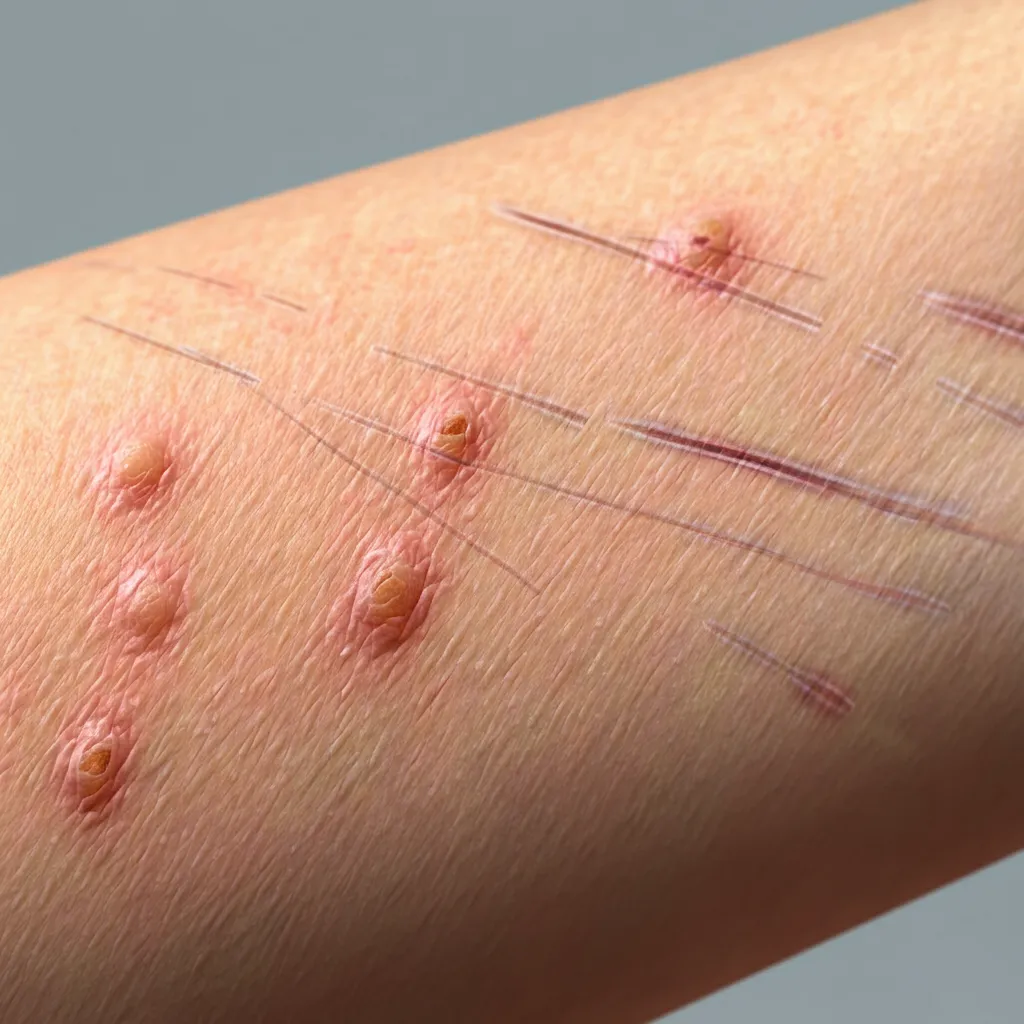
Scratch mark pattern recognition
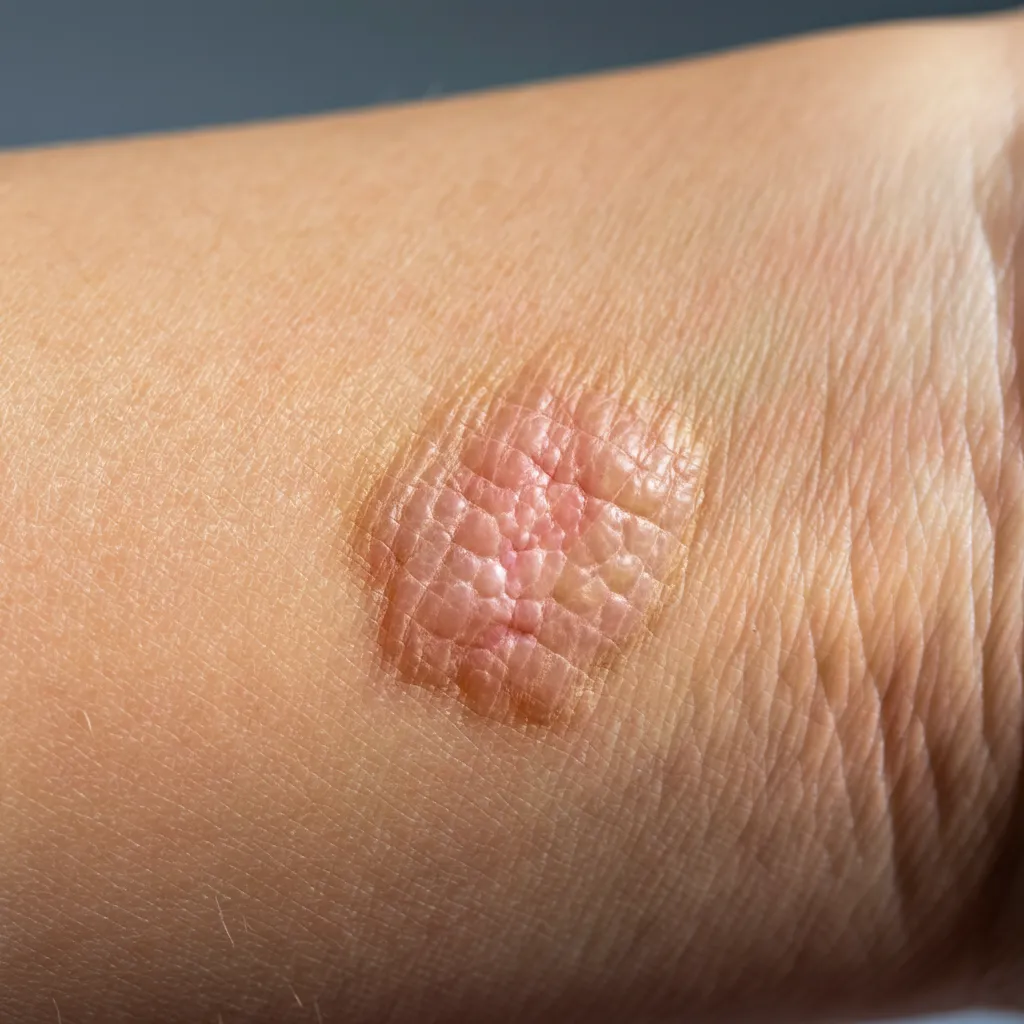
Thickened skin texture classification
Anonymization
All photographs are processed with automatic face anonymization, ensuring patient privacy for stored and exported images.
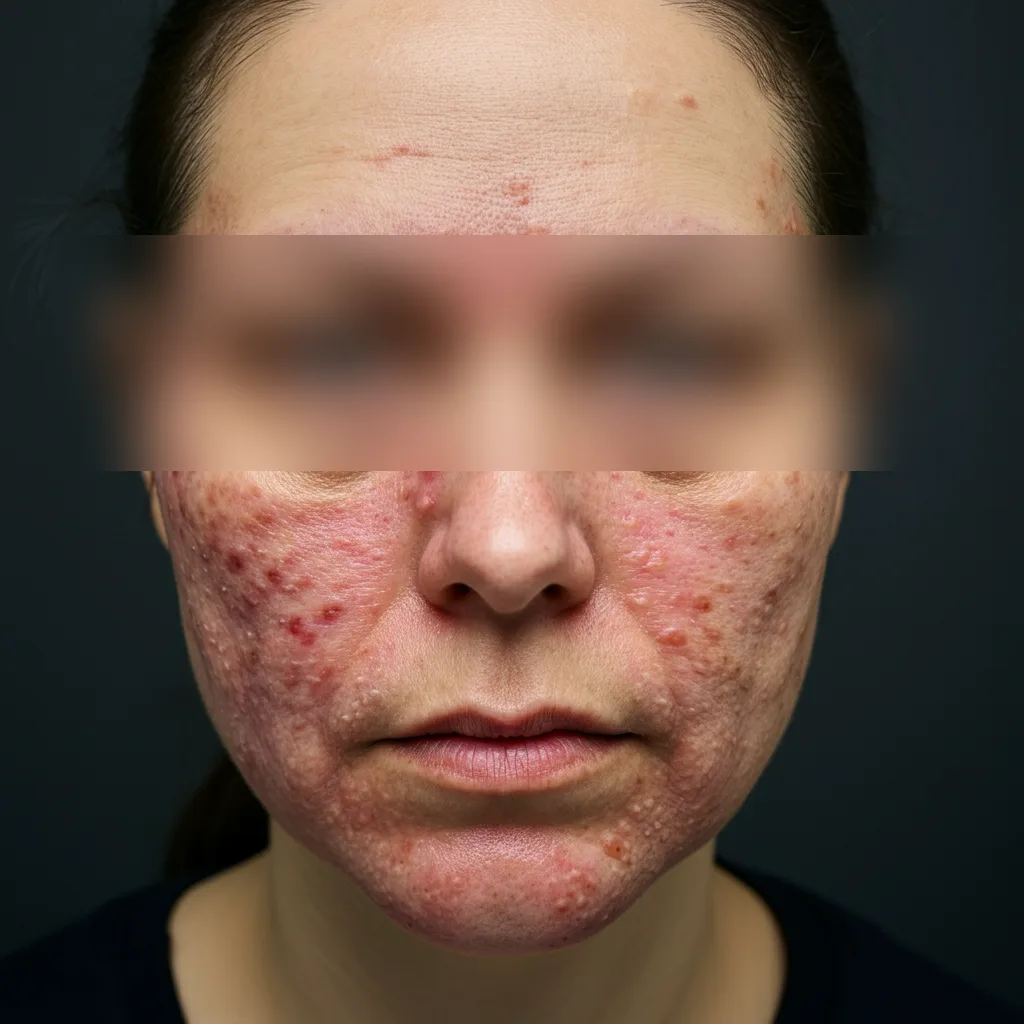
Irreversible face blurring applied
Longitudinal severity tracking
The platform tracks SCORAD evolution across visits from screening to end of study:
Baseline: AI erythema segmentation, ~14% of the visible area affected
Follow-up: affected area reduced to ~5% after treatment
What longitudinal tracking delivers
- SCORAD trajectory: Score at every visit from screening to end of study
- Absolute and percentage change from baseline at each visit
- Per-sign trend: Which intensity signs are driving improvement or worsening
- BSA evolution: How the extent of affected area changes over time
- Visual chart: Graphical severity curve across all timepoints
Data export for EDC integration
All assessment outputs are structured for export to the sponsor's EDC system:
| Field | Description |
|---|---|
| Patient ID | Pseudonymised study identifier |
| Visit ID | Visit number or scheduled timepoint |
| Timestamp | UTC timestamp of capture and processing |
| Total BSA (%) | Affected body surface area |
| Per-sign scores | Erythema, oedema, oozing, excoriations, lichenification, dryness (each 0–3) |
| Objective SCORAD | Computed objective component (0–72) |
| Total SCORAD | Including patient-reported symptoms (0–103) |
| Severity classification | Mild / Moderate / Severe |
Data is transferred automatically via RESTful API or CSV/Excel export. Legit.Health provides IQ/OQ documentation and data mapping specifications.
Reliability of the scores
The ASCORAD system was validated in a peer-reviewed pilot study (Medela et al., JID Innovations, 2022). Like all Legit.Health scoring systems, ASCORAD is perfectly reproducible: the identical image always produces the identical score, at every site, without calibration drift.
For the full validation evidence: Clinical Evidence →