Sample Outputs and Deliverables
This page shows the concrete outputs that sponsors, CROs, and investigators receive from each alopecia severity assessment. The AI generates standardised SALT reports immediately after image submission.
Per-visit SALT report
Each set of four scalp images generates a complete SALT report with per-quadrant breakdowns, available within seconds of upload:
ASALT
Score: 55
Report Information
Timestamp
7/25/2026, 8:03:01 PM
Analysis performed in
1.2 seconds
Body site
Left of the head
Image quality
68%
Body site
Right of the head
Image quality
66%
Body site
Top of the head
Image quality
63%
Body site
Back of the head
Image quality
55%
What the report contains
| Output | Detail |
|---|---|
| Total SALT score | Global SALT score (0–100) with severity classification |
| Per-quadrant hair loss % | Left (18%), Right (18%), Top (40%), Back (24%) |
| Per-quadrant SALT contribution | Weighted SALT component per quadrant |
| Severity classification | None / Limited / Moderate / Severe / Very Severe |
| SALT response flags | SALT 50 / 75 / 90 / 100 vs. baseline (when applicable) |
| Image quality (DIQA) | Quality score per perspective; failed images flagged for recapture |
| Timestamp | UTC timestamp of capture and AI processing |
The system automatically computes SALT responder status at every visit relative to baseline. For trials monitoring alopecia as a safety signal (e.g., MASH/MASLD trials), this provides objective, visit-by-visit documentation of any alopecia development without requiring manual SALT estimation.
Longitudinal SALT tracking and automated alerts
The platform tracks SALT score evolution across all visits and can trigger automated notifications when clinically significant changes are detected.
Longitudinal tracking
At each visit the system computes:
- Absolute SALT change from baseline
- Percentage change from baseline
- SALT response classification: SALT 50 / 75 / 90 / 100 flag at each visit
- Per-quadrant trend: Which scalp region is driving change
- Score trajectory: Visual severity evolution across all timepoints
Automated alert system
The platform supports configurable automated alerts for safety monitoring:
| Setting | Detail |
|---|---|
| Trigger | SALT increase ≥ 25% from baseline (configurable) |
| Recipient | Site email address |
| Threshold type | Inclusive (≥ 25%, not > 25%) to avoid missing borderline cases |
| Response | Investigator confirms finding clinically; escalates per protocol if confirmed |
This alert system is particularly valuable for Phase 3 trials where alopecia is monitored as a treatment-emergent adverse event — sites are notified automatically without requiring manual data review.
MASH/MASLD safety deployment example
In a Phase 3 MASH/MASLD trial, investigators captured 4-perspective scalp images at scheduled clinic visits. SALT scores were computed automatically and monitored for any alopecia development related to the investigational therapy. The alert system flagged cases meeting the threshold for investigator review.
Data export for EDC integration
All assessment outputs are structured for export to the sponsor's EDC system. Fields exported at each visit:
| Field | Description | Format |
|---|---|---|
| Patient identifier | Study-specific pseudonymised ID | String |
| Visit date | Date and timestamp of the assessment | ISO 8601 |
| Total ASALT score | Global SALT score (0–100) | Float |
| Regional ASALT scores | ASALT score per quadrant (left, right, top, back) | Float (0–100) per region |
| Severity classification | None / Limited / Moderate / Severe / Very Severe | String |
| SALT response flags | Binary flags for SALT 50, SALT 75, SALT 90, SALT 100 response vs. baseline | Boolean per threshold |
| Change from baseline | Absolute and percentage change in ASALT from baseline | Float |
| DIQA scores | Image quality score per perspective | Float |
| Alert triggered | Whether the assessment triggered an automated notification based on threshold | Boolean |
Data is transferred automatically via RESTful API or CSV/Excel export. Legit.Health provides IQ/OQ documentation and data mapping specifications for all major EDC platforms.
AI visual outputs
Beyond scores, the AI produces visual artefacts that demonstrate exactly what the system detected and how it reached its conclusion.
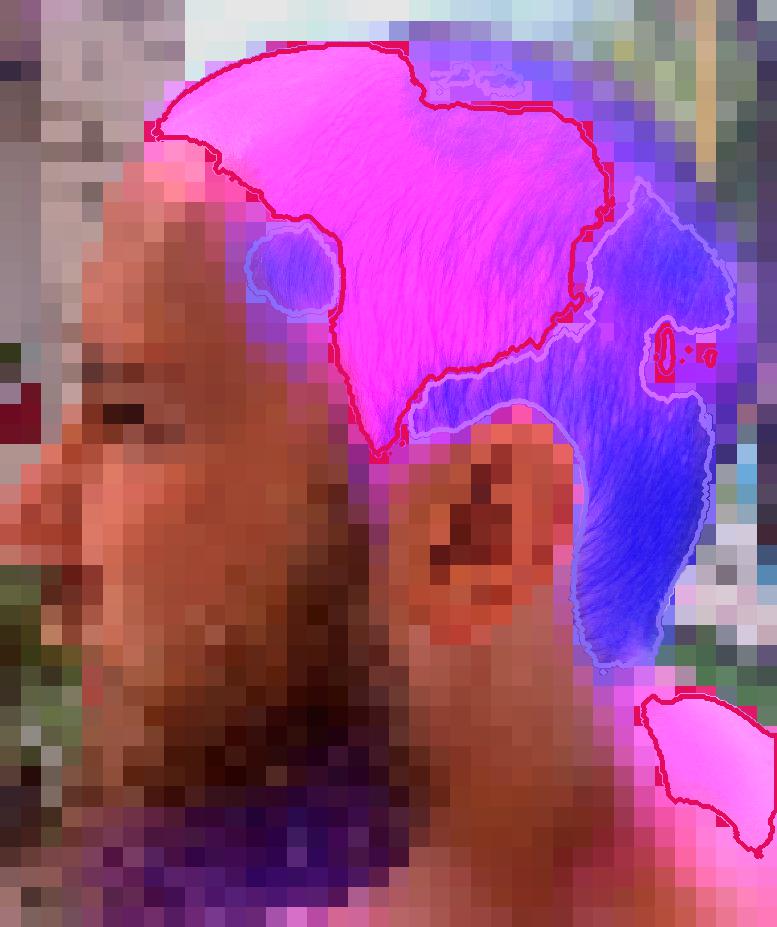
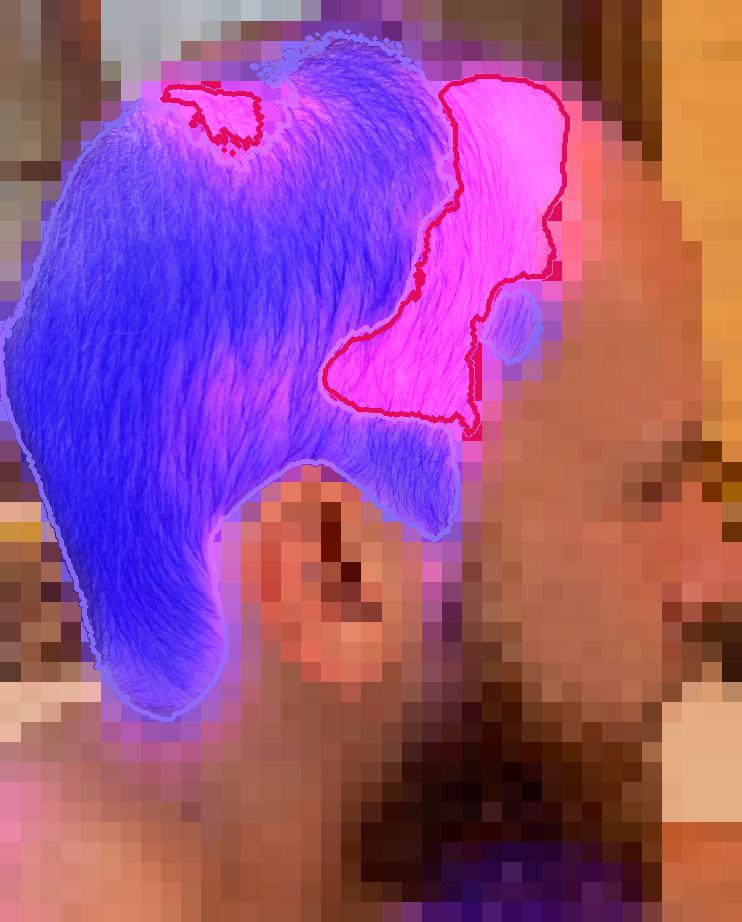
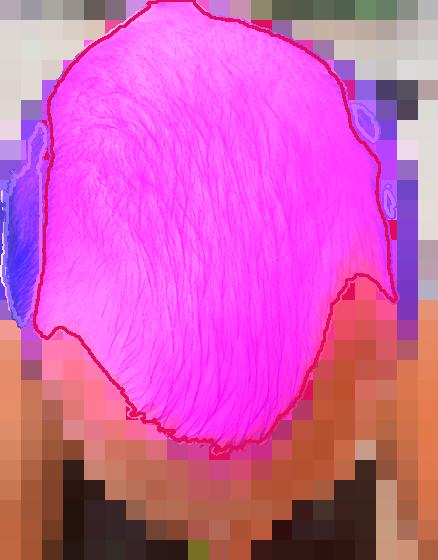
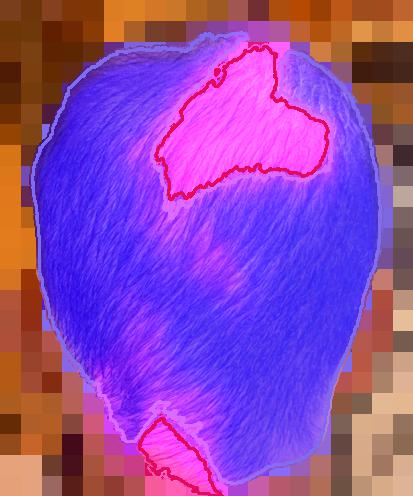
Hair loss segmentation masks
For each scalp quadrant, the AI generates a pixel-level segmentation mask classifying each region as hair-bearing or non-hair-bearing. This replaces visual estimation of hair loss percentage with an objective, continuous measurement.
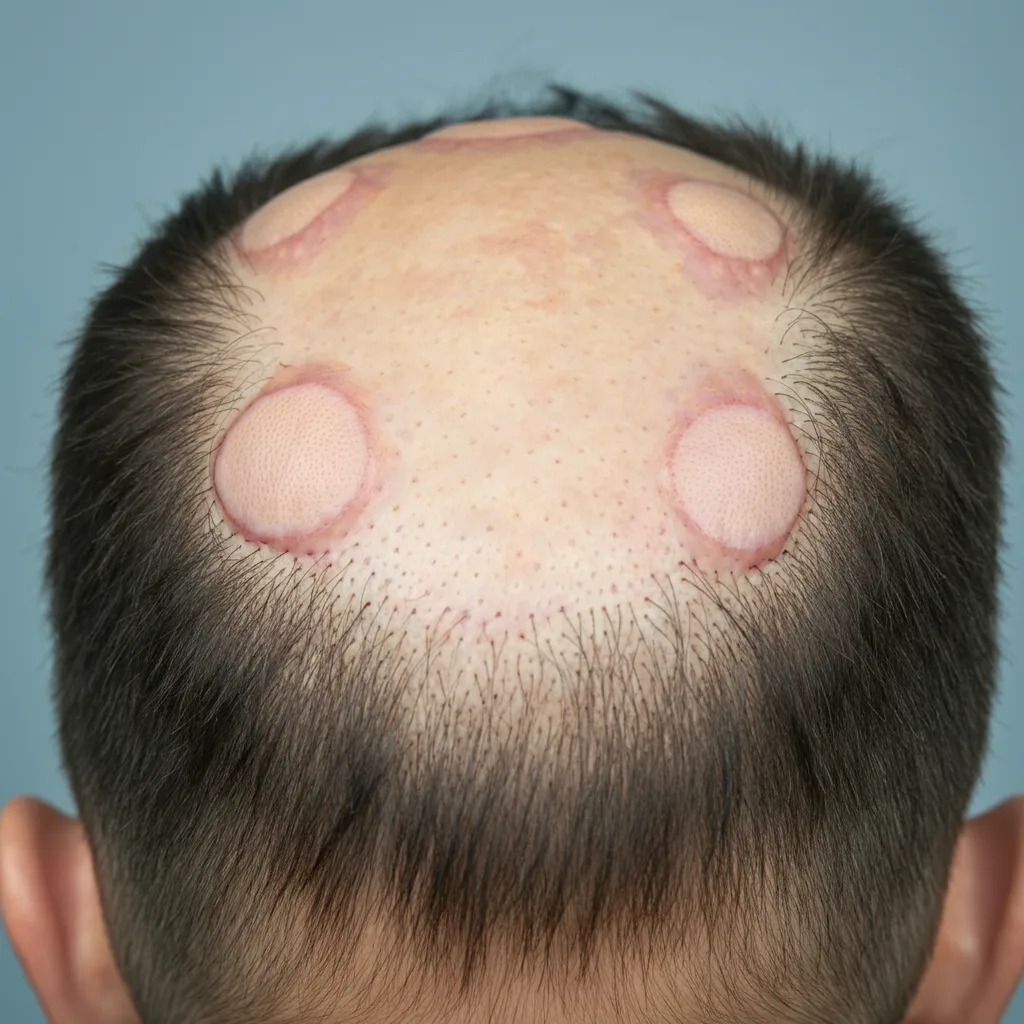
Input: scalp quadrant photograph
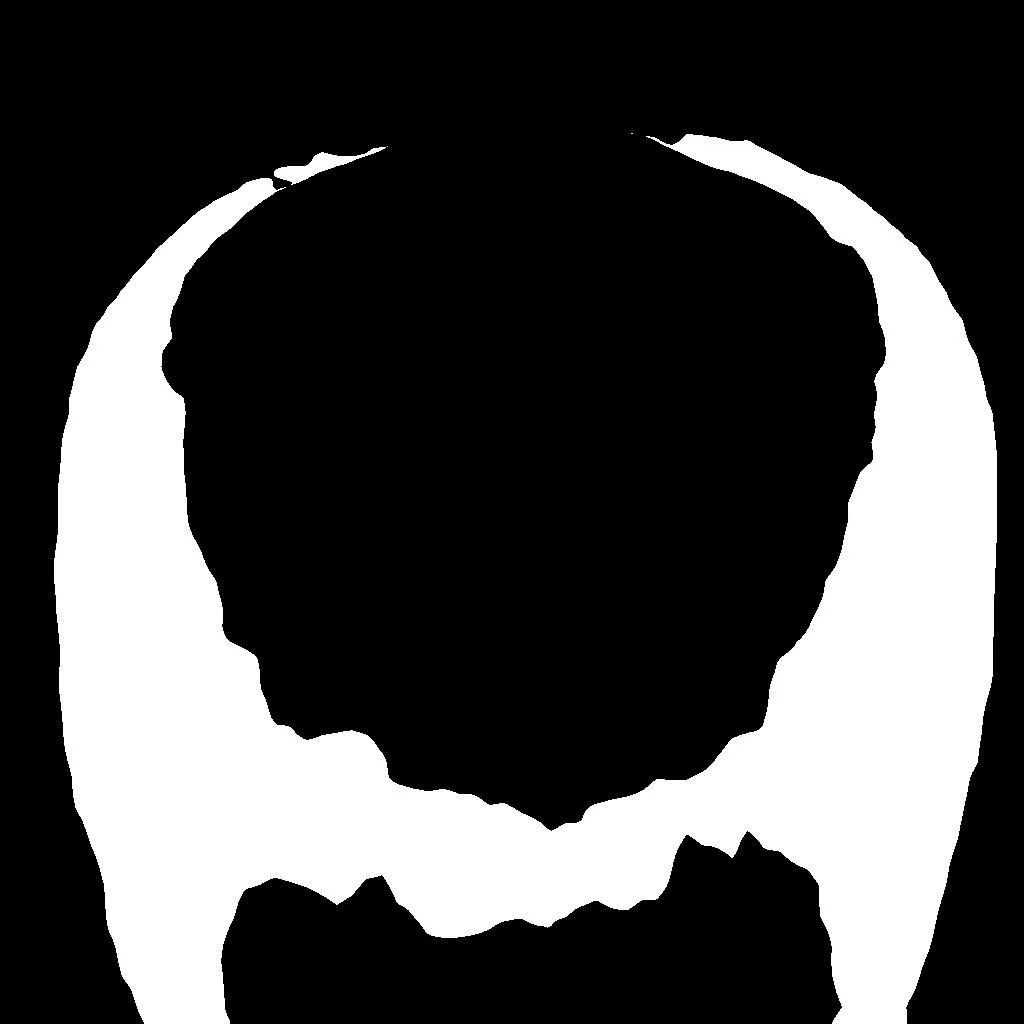
Output: hair-bearing (green) vs. hair loss (red) regions
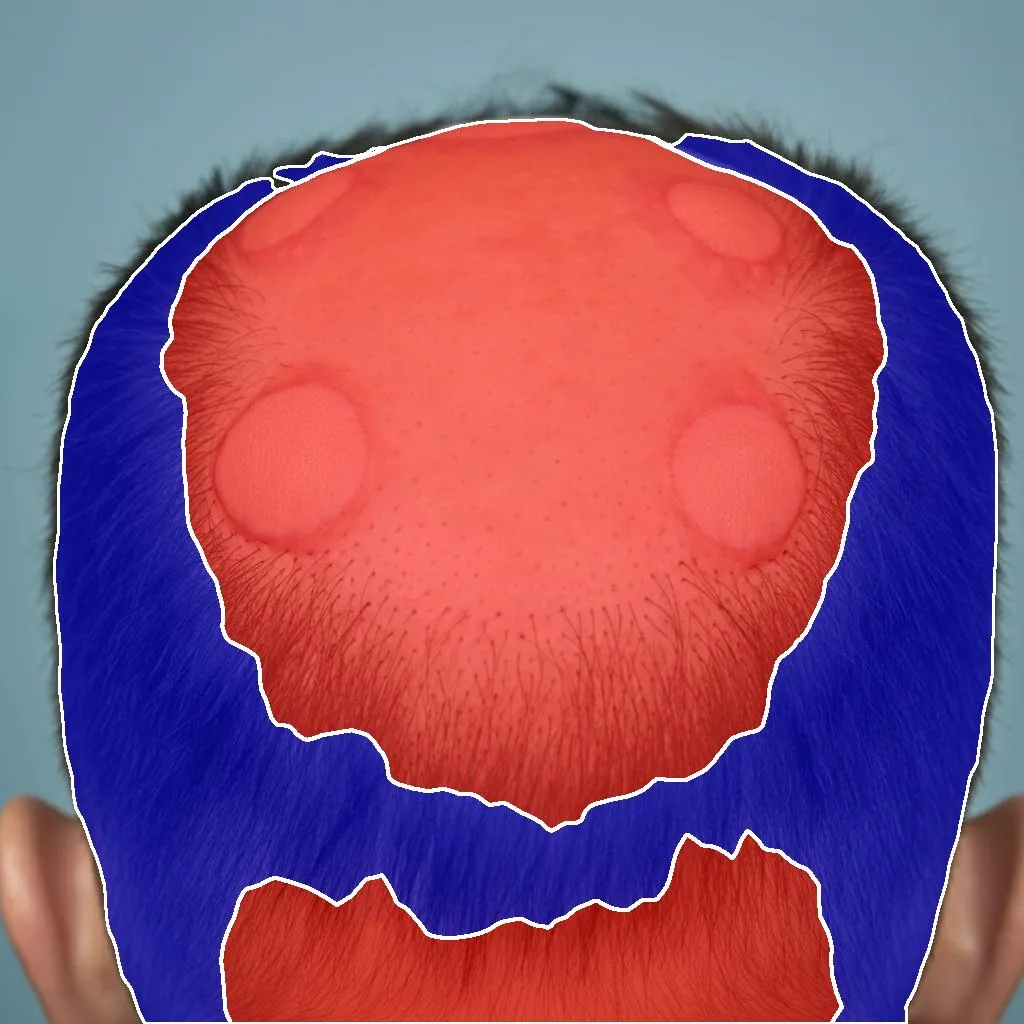
Combined: segmentation overlaid on photograph
Hair follicle detection (trichoscopy)
When dermoscopic/trichoscopy images are available, the AI performs individual hair follicle detection with bounding boxes, providing follicle density measurements at sub-quadrant granularity.
Input: dermoscopic scalp image
Output: individual follicles detected (mAP@50 = 0.816)
T0 → T1 evolution comparison
The platform enables side-by-side visual comparison of scalp quadrants across visits, with segmentation masks overlaid, so investigators can see exactly where hair loss has progressed or regressed.
Baseline: SALT 55, segmentation mask
Follow-up: SALT change from baseline
Reliability of the scores
The automated SALT system is validated at non-inferiority to expert inter-rater variability for segmentation and severity scoring. The AI produces the identical score for the same image every time, across every site, without calibration drift.
For the full validation evidence: Clinical Evidence →