Sample Outputs and Deliverables
This page shows the concrete outputs that sponsors, CROs, and investigators receive from each psoriasis PASI assessment. The AI generates structured APASI reports immediately after image submission — no central reader, no manual scoring, no delays.
Per-visit PASI report
Each image submission generates a complete APASI report with per-region breakdowns, accessible within seconds of upload:
Psoriasis Area and Severity Index
PASI 13.6
Report Information
Timestamp
7/25/2026, 8:03:00 PM
Analysis performed in
2.1 seconds

Body region
Head
Image quality
91%
Erythema
2Desquam.
2Induration
1BSA covered
30%
Region PASI
1.0

Body region
Trunk
Image quality
89%
Erythema
3Desquam.
2Induration
2BSA covered
15%
Region PASI
4.2

Body region
Upper extremities
Image quality
93%
Erythema
2Desquam.
1Induration
2BSA covered
10%
Region PASI
2.0

Body region
Lower extremities
Image quality
87%
Erythema
3Desquam.
3Induration
2BSA covered
20%
Region PASI
6.4
What the report contains
| Output | Detail |
|---|---|
| Global APASI score | Composite PASI score (0–72) |
| Per-region erythema | Intensity score (0–4) for head, trunk, upper extremities, lower extremities |
| Per-region desquamation | Intensity score (0–4) per body region |
| Per-region induration | Intensity score (0–4) per body region (estimated from visual cues) |
| Per-region BSA | Affected body surface area (%) via pixel-level segmentation |
| Per-region PASI contribution | Weighted PASI component per region |
| PASI response flags | PASI 75, PASI 90, PASI 100 vs. baseline (when applicable) |
| Image quality (DIQA) | Quality score per perspective; failed images flagged for recapture |
| Timestamp | UTC timestamp of capture and AI processing |
PASI 75, PASI 90, and PASI 100 responder flags are computed automatically at every visit relative to baseline. Sponsors can track response rates in real time without waiting for data transfer or manual calculation.
Longitudinal PASI tracking
The platform tracks PASI evolution across all visits for each patient. At each timepoint the system computes:
- Absolute PASI change from baseline
- Percentage change from baseline
- PASI response classification: PASI 75 / 90 / 100 flag at each visit
- Per-region trend: Which body region is driving improvement or worsening
- Score trajectory: Visual evolution from screening through long-term extension
This enables per-patient treatment response monitoring and facilitates data review meetings without requiring database lock.
Phase 3 deployment example
In the JNJ-77242113 Phase 3 trial for moderate-to-severe plaque psoriasis, patients captured 11 standardised photographs at home across 6 timepoints. The AI processed all images and delivered APASI scores and response rate data to the sponsor's data science team via automated monthly S3 exports. Across 130+ sites in 12 countries, all data was available without a single central reader.
Data export for EDC integration
All assessment outputs are structured for export to the sponsor's EDC system. Fields exported at each visit:
| Field | Description | Format |
|---|---|---|
| Patient identifier | Study-specific pseudonymised ID | String |
| Visit date | Date and timestamp of the assessment | ISO 8601 |
| Global APASI score | Composite PASI score (0–72) | Float |
| Per-region PASI | Regional PASI contribution for head, trunk, upper extremities, lower extremities | Float per region |
| Erythema per region | Erythema intensity score (0–4) per body region | Integer |
| Desquamation per region | Desquamation intensity score (0–4) per body region | Integer |
| Induration per region | Induration intensity score (0–4) per body region | Integer |
| BSA per region | Affected body surface area percentage per region | Float (%) |
| DIQA scores | Image quality score per perspective | Float |
| PASI response | PASI 75/90/100 response flag (percentage improvement from baseline) | Boolean per threshold |
Data is transferred automatically via RESTful API, scheduled S3 export, or CSV/Excel. Legit.Health provides IQ/OQ documentation and data mapping specifications for all major EDC platforms (Medidata Rave, Oracle InForm, Veeva Vault EDC).
AI visual outputs
Beyond scores, the AI produces visual artefacts that demonstrate exactly what the system detected and how it reached its conclusion.
BSA segmentation masks
For each body region, the AI generates a pixel-level segmentation overlay showing exactly which skin areas are classified as affected by psoriasis. This replaces the most subjective component of manual PASI scoring — visual BSA estimation — with an objective measurement.

Input: standardised body region photograph
Output: psoriatic plaques highlighted by AI segmentation
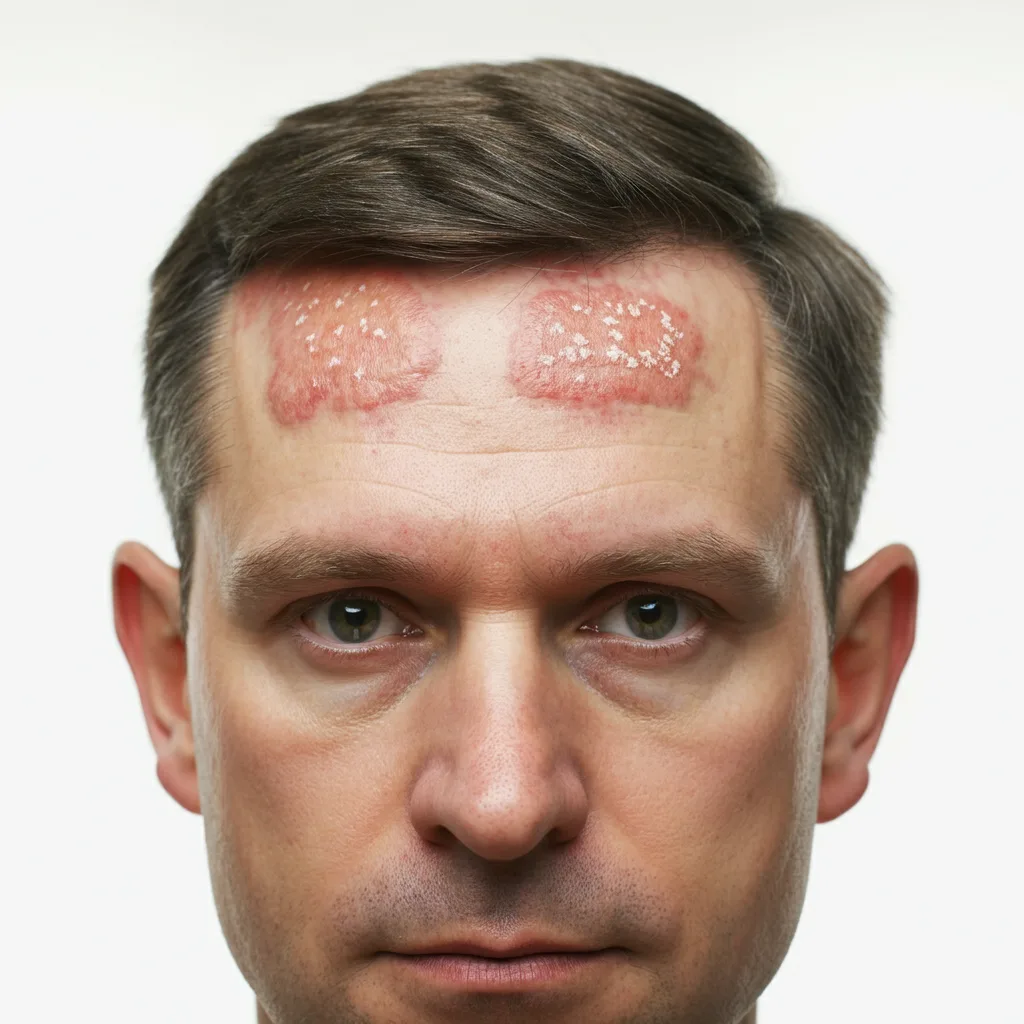
Per-sign intensity scoring
Each PASI component sign (erythema, desquamation, induration) is scored independently from the close-up perspective for each body region. The AI analyses the representative plaque photograph to determine the 0–4 integer score for each sign.
Head: E2 / D2 / I1

Trunk: E3 / D2 / I2
Upper extremities: E2 / D1 / I2
Lower extremities: E3 / D3 / I2
Pose estimation and perspective alignment
The 11-perspective full-body protocol uses body pose estimation to confirm which body region each photograph captures and to ensure correct PASI regional attribution. The AI maps anatomical landmarks to align images with the four PASI body regions.
Perspective identification via body landmarks
Automatic attribution to head / trunk / upper / lower extremities
Anonymization
All photographs are processed with automatic face anonymization. The system applies irreversible blurring to facial features, ensuring no patient is identifiable from stored or exported images. Body images are inherently less identifiable; anonymization is applied where faces are visible.
Original full-body capture
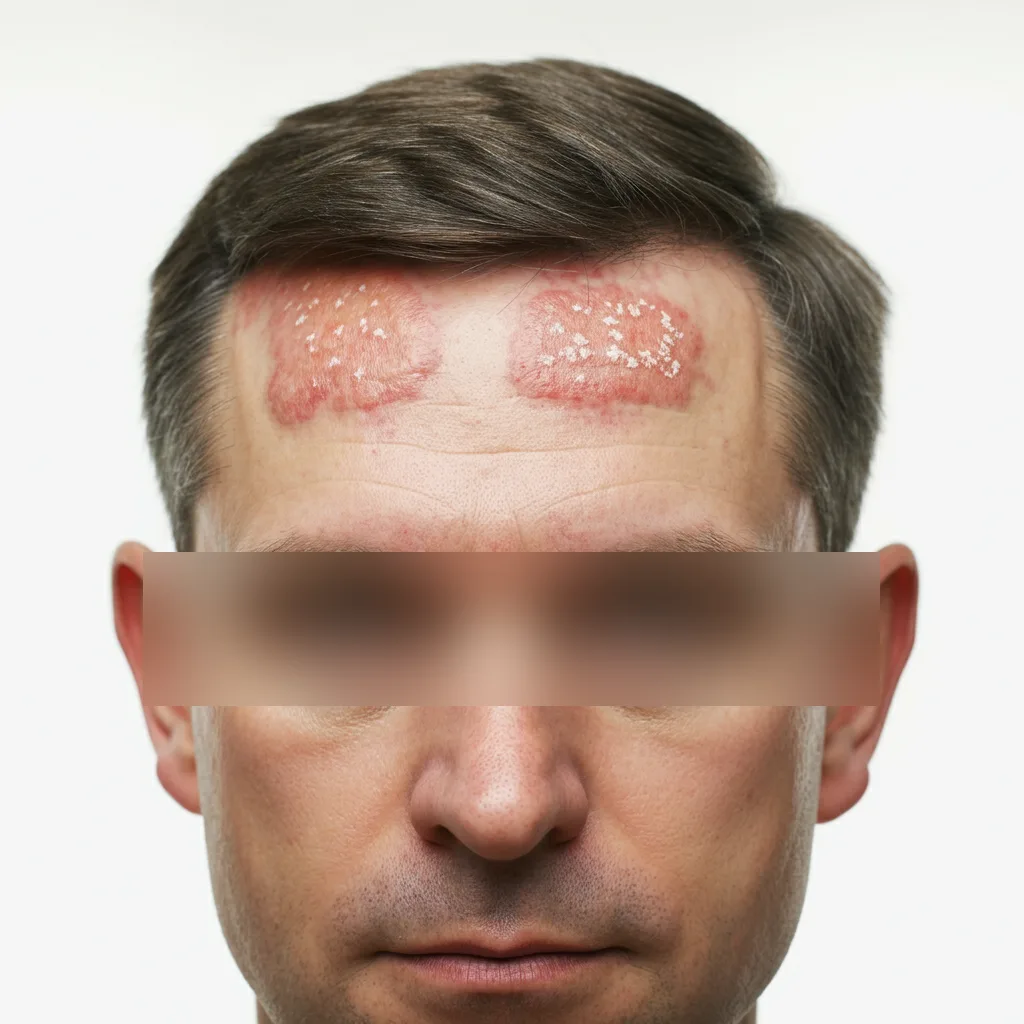
Irreversible face blurring applied
Reliability of the scores
The APASI system components are each validated to perform at the level of expert inter-rater agreement:
| Component | AI performance | Expert inter-rater variability | Verdict |
|---|---|---|---|
| Erythema | RMAE 0.13 | RMAE ~0.14 | AI meets expert level |
| Desquamation | RMAE 0.14 | RMAE ~0.17 | AI meets expert level |
| Induration | RMAE 0.151 | RMAE ~0.17 | AI meets expert level |
| BSA (segmentation) | IoU 0.61 | — | Pixel-level objectivity |
The AI produces the identical score for the same image every time, across every site, without calibration drift. For the full validation evidence: Clinical Evidence →