Worked Example: From Capture to Scored Report
The other pages in this section describe the protocol, the scoring methodology, and the validation evidence separately. This page walks the same sequence in order, so you can see what each step looks like before committing to it in a protocol.
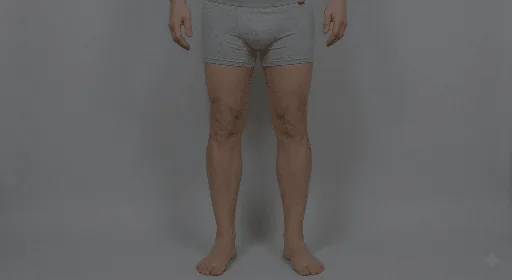
The photographs are generated images, not a real subject, captured under the standard 8-image full-body protocol. The segmentation overlays in section 3 are the device's own output on exactly those photographs. The report in section 4 and the alert in section 5 show the format of each, using the standard example values carried by the report components; their numbers are not derived from the photographs above.
This is an illustration of the platform, not a study report, and not a single subject followed across visits. Perspective counts, endpoints, and alert thresholds are all configurable per protocol. See Trial Workflow for how a study is set up.
1. What the subject sees
The mobile application guides the capture one perspective at a time. Each tile shows the silhouette the subject aligns to, and the application validates quality and pose in real time before accepting the image.
Seven whole-body views together cover total body surface area. Four close-ups follow, one per anatomical region, which is what the intensity models score. Nothing is accepted until it passes the quality check, so a blurred or badly framed photograph is retaken at the point of capture rather than discovered later.
2. What the subject submits
These are the seven whole-body perspectives from a single visit.
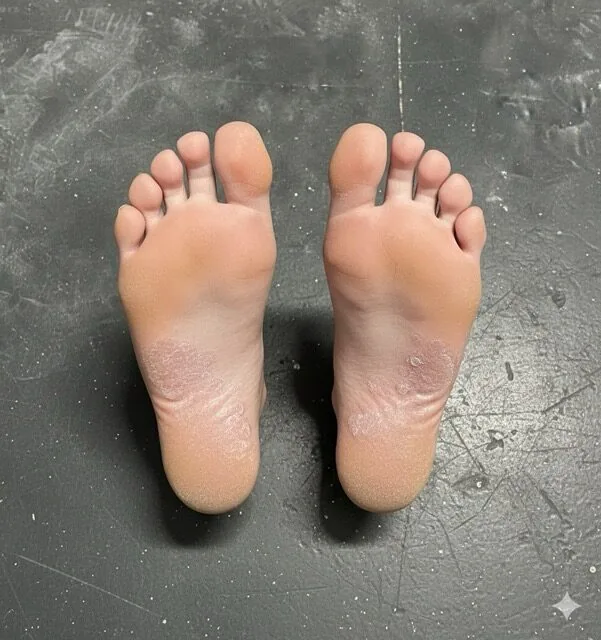
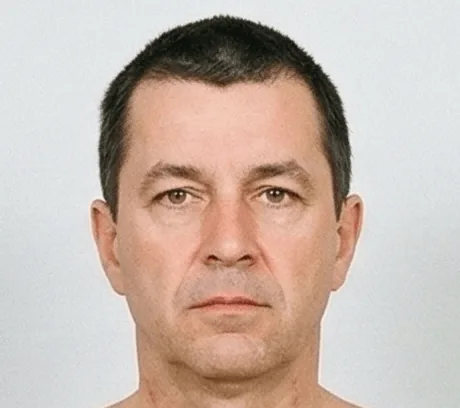
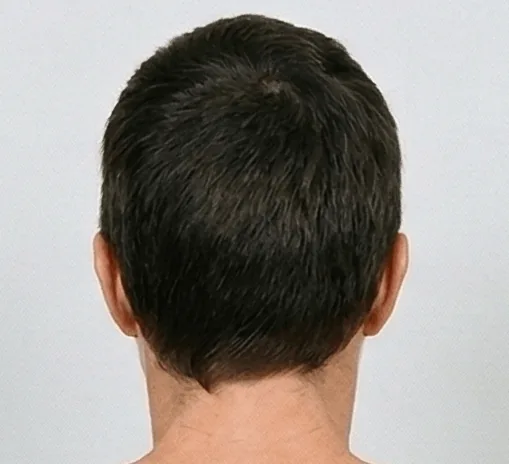
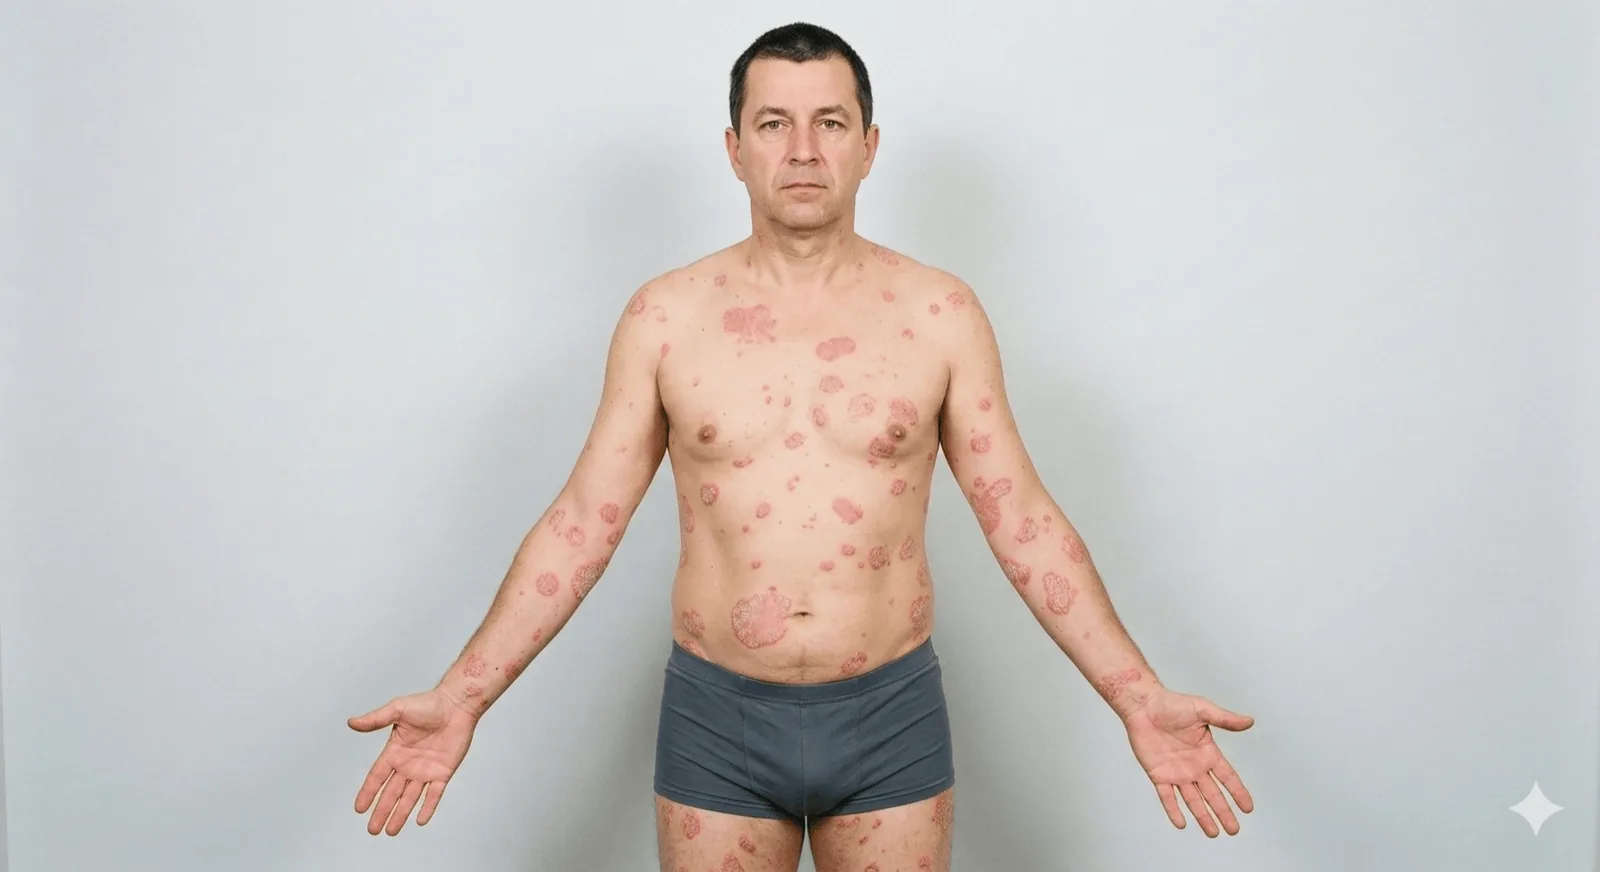
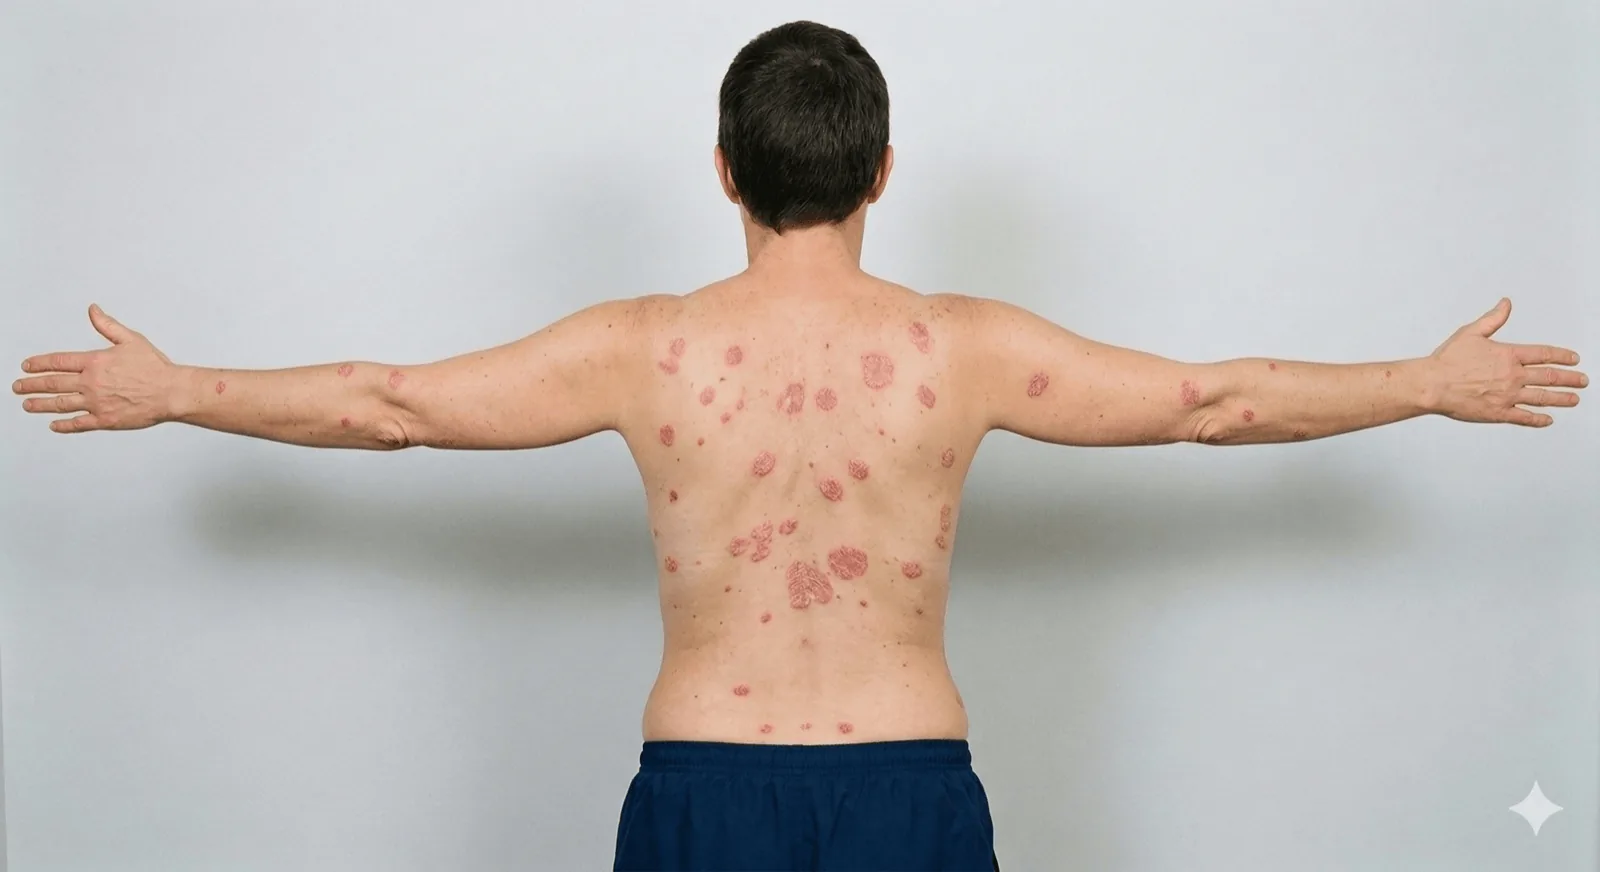
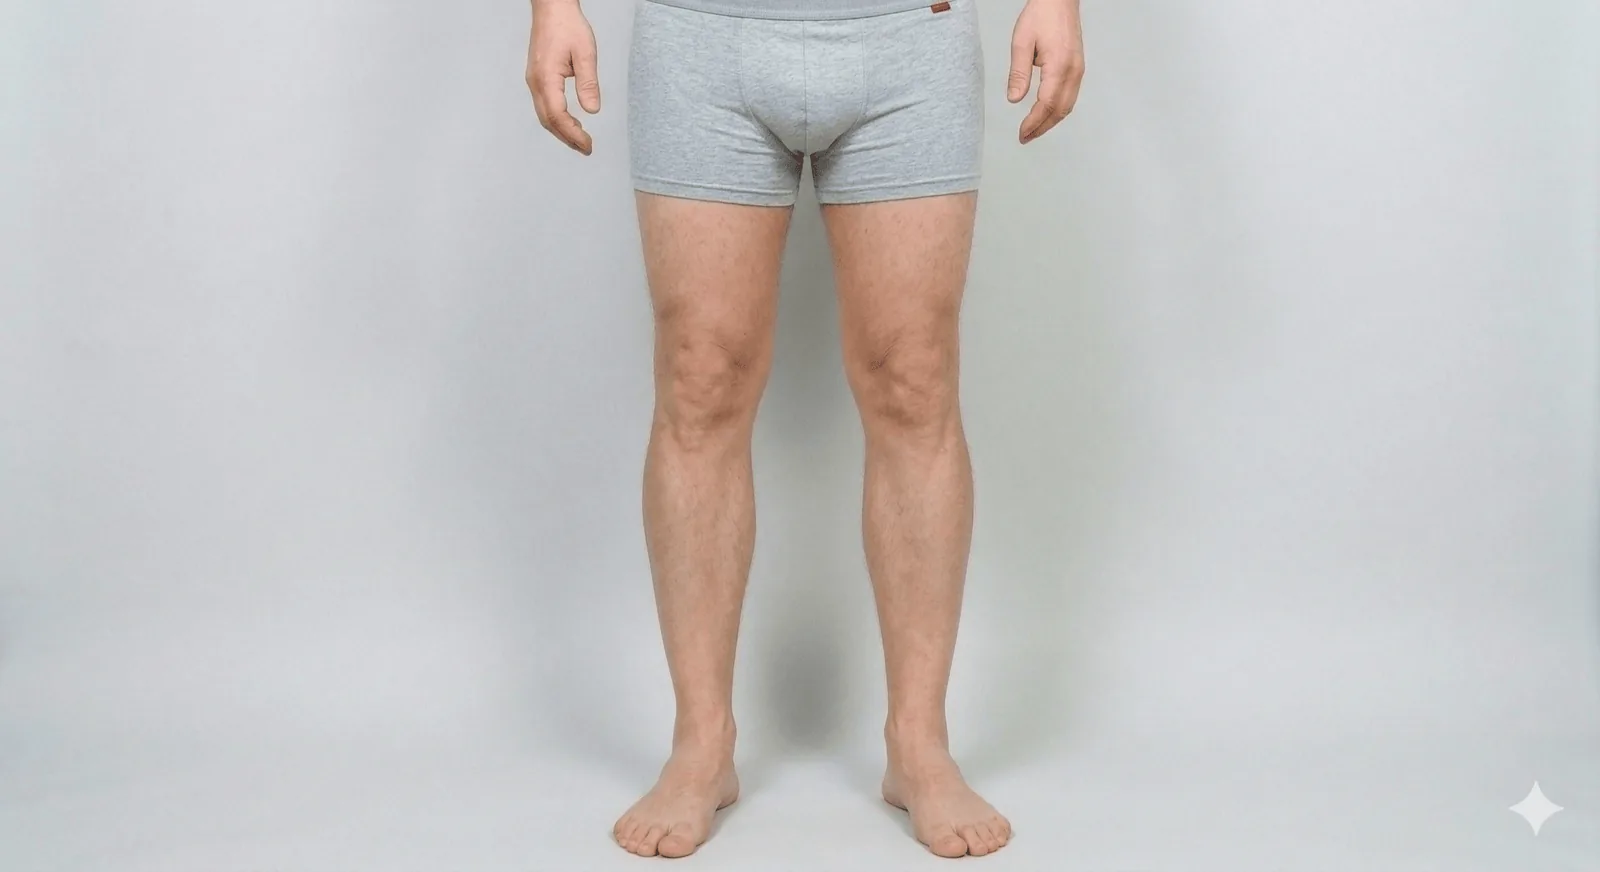
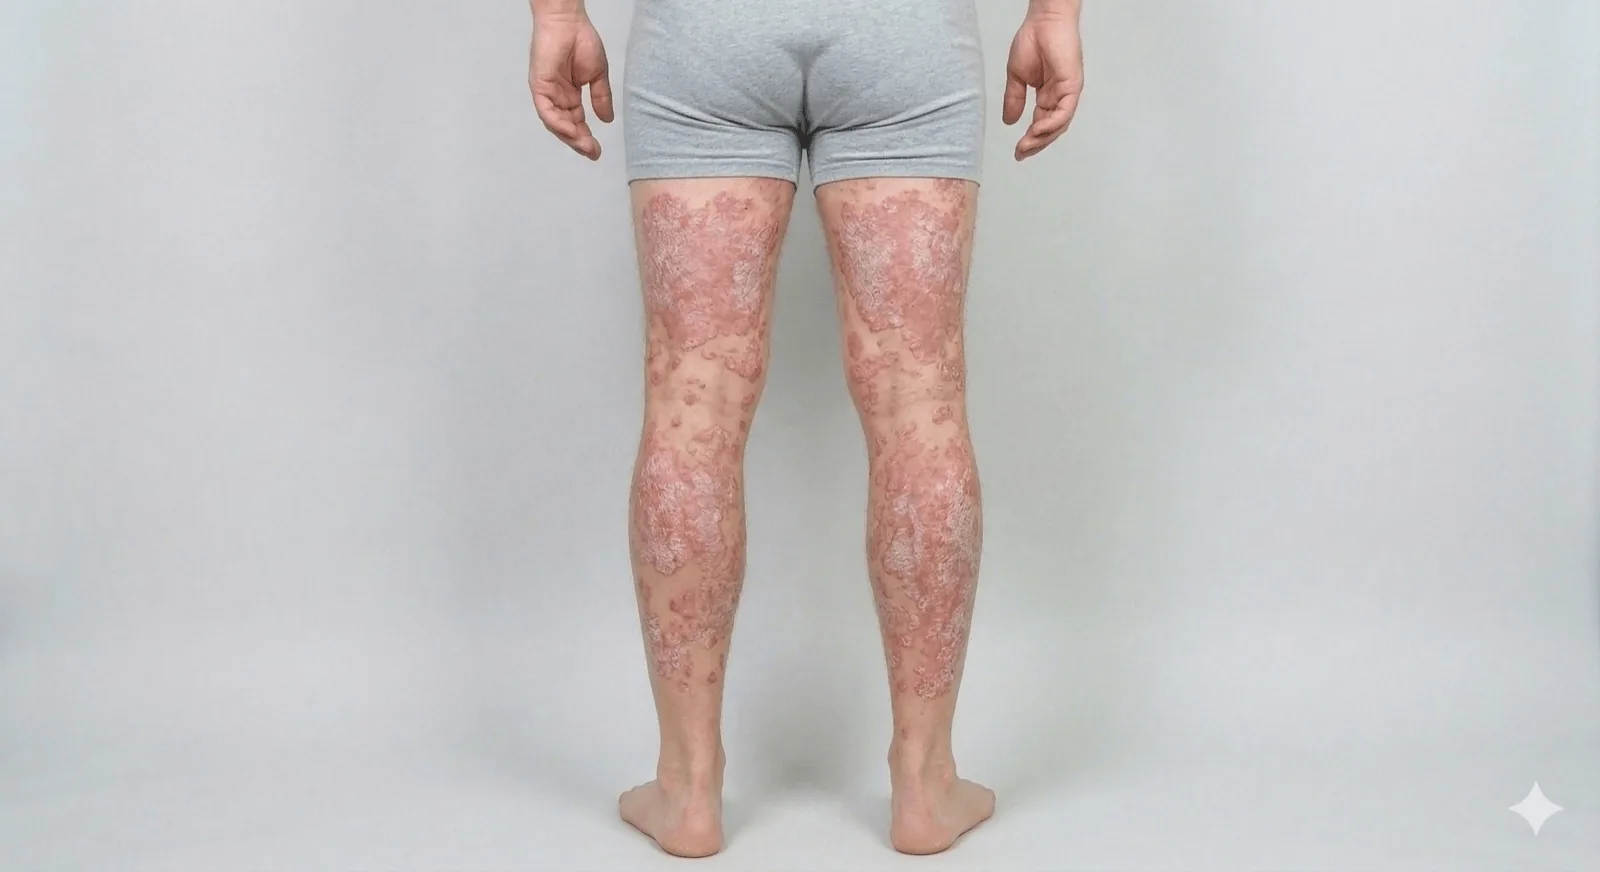
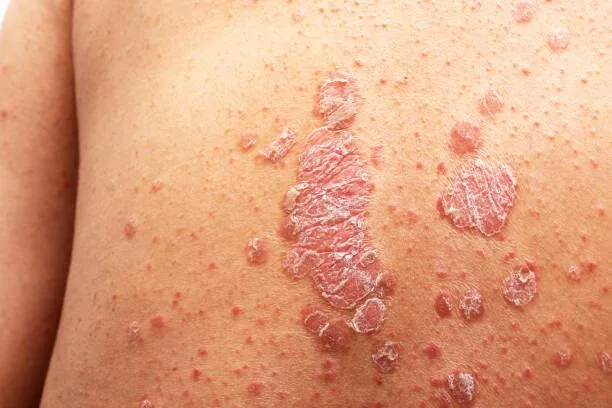
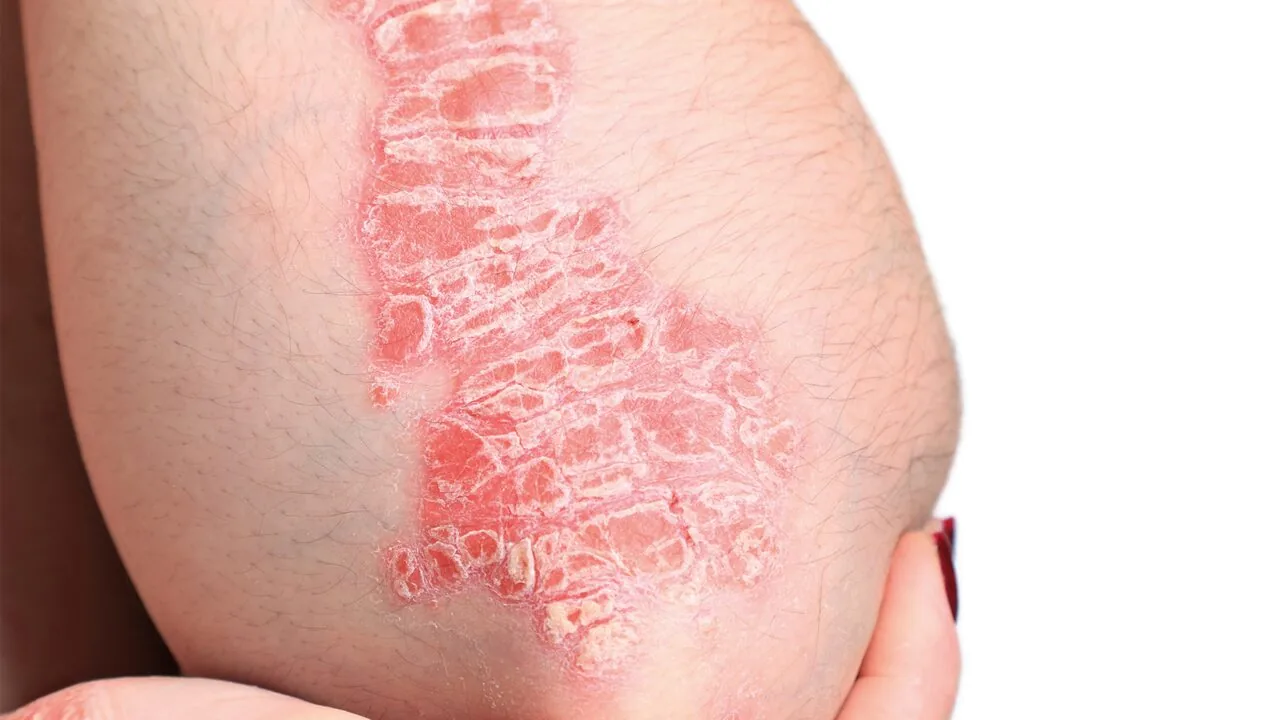
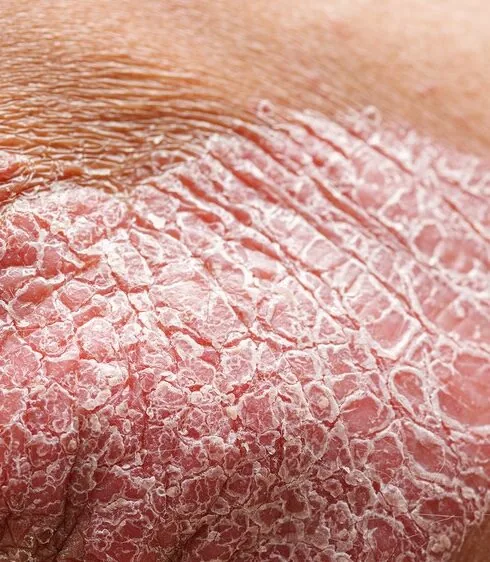
And these are the four close-ups, one per region, which carry the detail the intensity models need.
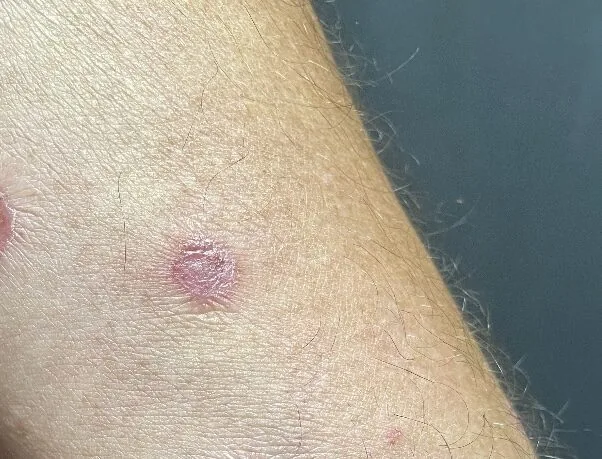
3. What the AI returns
Each whole-body perspective comes back with a pixel-level segmentation of psoriatic area. This is what replaces the investigator's visual estimate of body surface area, which is the largest single source of disagreement between raters in manual PASI.
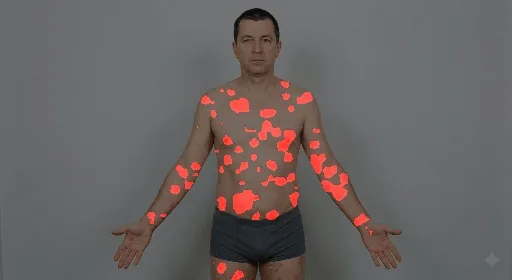
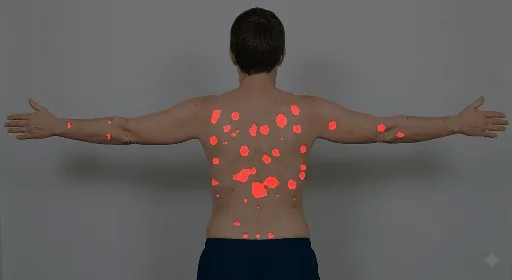
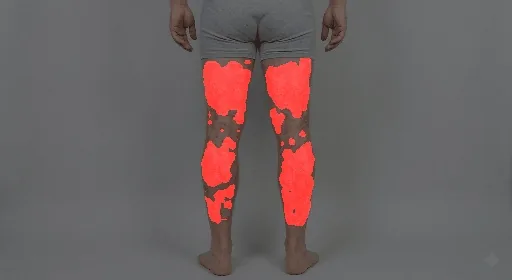
Alongside the area segmentation, dedicated models score erythema, desquamation and induration. Their measured agreement against dermatologist consensus, and how that compares with the dermatologists' agreement with each other, is set out on Clinical evidence.
4. The scored report
The four intensity components are scored across the four PASI body regions, giving the sixteen individual assessments that a manual PASI requires, plus the area term for each region. The report below shows that layout, populated with the standard example values rather than a score computed from the photographs above.
Psoriasis Area and Severity Index
PASI Score: 13.6
Report Information
Timestamp
12/02/2026, 09:41:12
Analysis performed in
1.8 seconds
Status
Not reviewed
| Body region | Weight | Erythema | Desquamation | Induration | BSA % | Area score | Region PASI |
|---|---|---|---|---|---|---|---|
| Head | 0.1 | 2 | 2 | 1 | 30% | 2 | 1.0 |
| Trunk | 0.3 | 3 | 2 | 2 | 15% | 2 | 4.2 |
| Upper extremities | 0.2 | 2 | 1 | 2 | 10% | 1 | 2.0 |
| Lower extremities | 0.4 | 3 | 3 | 2 | 20% | 2 | 6.4 |
The report is available within seconds of the last image being accepted. There is no central reader and no scoring queue. Trial Workflow covers the report contents and the EDC export in full.
5. Automatic response milestones
Across visits, the platform compares each new score with the subject's baseline and flags the first visit at which a response threshold is met, so the site does not have to compute it.
| Field | Value |
|---|---|
| Subject | Example subject |
| Visit comparison | Baseline to Week 16 |
| Baseline PASI | 18.4 |
| Week 16 PASI | 2.8 |
| Improvement | 84.8%, meeting PASI 75 and not PASI 90 |
Illustrative values showing the alert format. Not a study result, and not the subject shown above.
Milestone events are recorded automatically and surfaced in the sponsor dashboard. The thresholds shown are the conventional PASI 75, 90 and 100; a protocol can define its own.
Where this fits
- Imaging Protocol for the capture requirements and the alternative perspective protocols
- Scoring Methodology for how the components combine into a PASI value
- Clinical evidence for the measured agreement against dermatologist consensus
- Trial Workflow for the full report contents and EDC export fields