Sample Outputs and Deliverables
This page shows the concrete outputs a sponsor, CRO or investigator receives from a cutaneous lupus erythematosus assessment. The AI generates a structured report within seconds of image submission, with no central reader and no manual scoring.
The images on this page are synthetic dermatology imagery generated for illustration, not patient records. The scores beside them are the actual values the medical device returned for those images. Because CLASI is not yet validated in a CLE population, they demonstrate what the report looks like and what the device measures, not how accurately it scores CLASI. See Limitations.
Per-visit assessment report
Each image submission produces a standardised CLASI report within seconds of upload, with per-region signs and the assembled Activity and Damage scores:
CLASI Activity
CLASI-A 11
Reversible activity, range 0–70
CLASI Damage
CLASI-D 6
Cumulative damage, range 0–56
Timestamp
9/12/2026, 7:28:01 PM
Analysis performed in
1.6 seconds
Region
Nose and malar area
Image quality (DIQA)
83%
Local CLASI-A (E + S)
3
Region
Rest of face
Image quality (DIQA)
91%
Local CLASI-A (E + S)
4
Region
Scalp
Image quality (DIQA)
81%
Local CLASI-A (E + S)
1
Example CLASI report. Synthetic imagery, real device outputs for the signs shown.
What the report contains
| Output | Detail |
|---|---|
| Erythema intensity | Graded severity of redness, the dominant CLASI-A activity sign |
| Scale and induration | Desquamation and plaque thickening, resolving the CLASI-A scale item |
| Depigmentation extent | Continuous measure of the depigmented area, feeding CLASI-D dyspigmentation |
| Hair loss percentage | Proportion of the scalp affected, for scalp regions |
| Assembled CLASI-A / CLASI-D | Activity and damage scores, from the per-region signs plus clinician-entered items |
| Segmentation overlays | Each sign's mask on the original photograph, for visual verification |
| Image quality (DIQA) | Quality score per capture; sub-threshold images flagged for recapture |
| Timestamp | UTC timestamp of capture and processing |
Three CLASI components are not read from the image (mucous membrane lesions, recent hair loss, and dyspigmentation duration). The investigator completes these at review and the platform assembles the full CLASI-A and CLASI-D. See Scoring methodology.
The repigmentation signal
This is the output CLASI cannot produce on its own. CLASI-D records dyspigmentation as a single present-or-absent item, so a lesion that is refilling with pigment holds the same damage score visit after visit. Because the device measures depigmentation as a continuous extent, the same pair of visits shows a clear, quantified improvement.
Baseline: depigmentation index 5.4, active erythema present
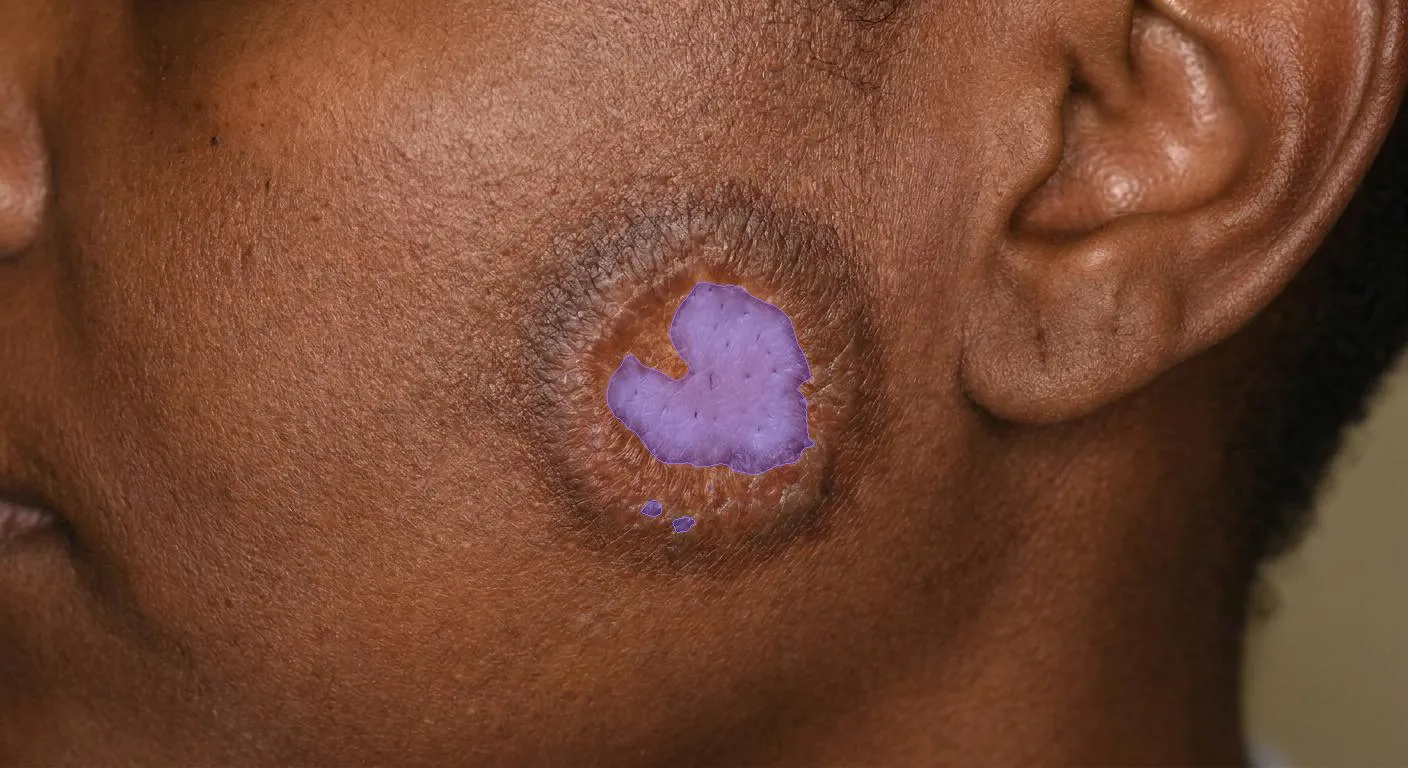
Follow-up: depigmentation index 2.7, erythema resolved
−50%
The continuous depigmentation measure roughly halves between the two visits and the mask visibly follows the repigmenting border. Over the same interval the binary CLASI-D dyspigmentation item does not move, because pigmentation is still abnormal. The improvement is real and the instrument alone cannot express it.
Longitudinal tracking
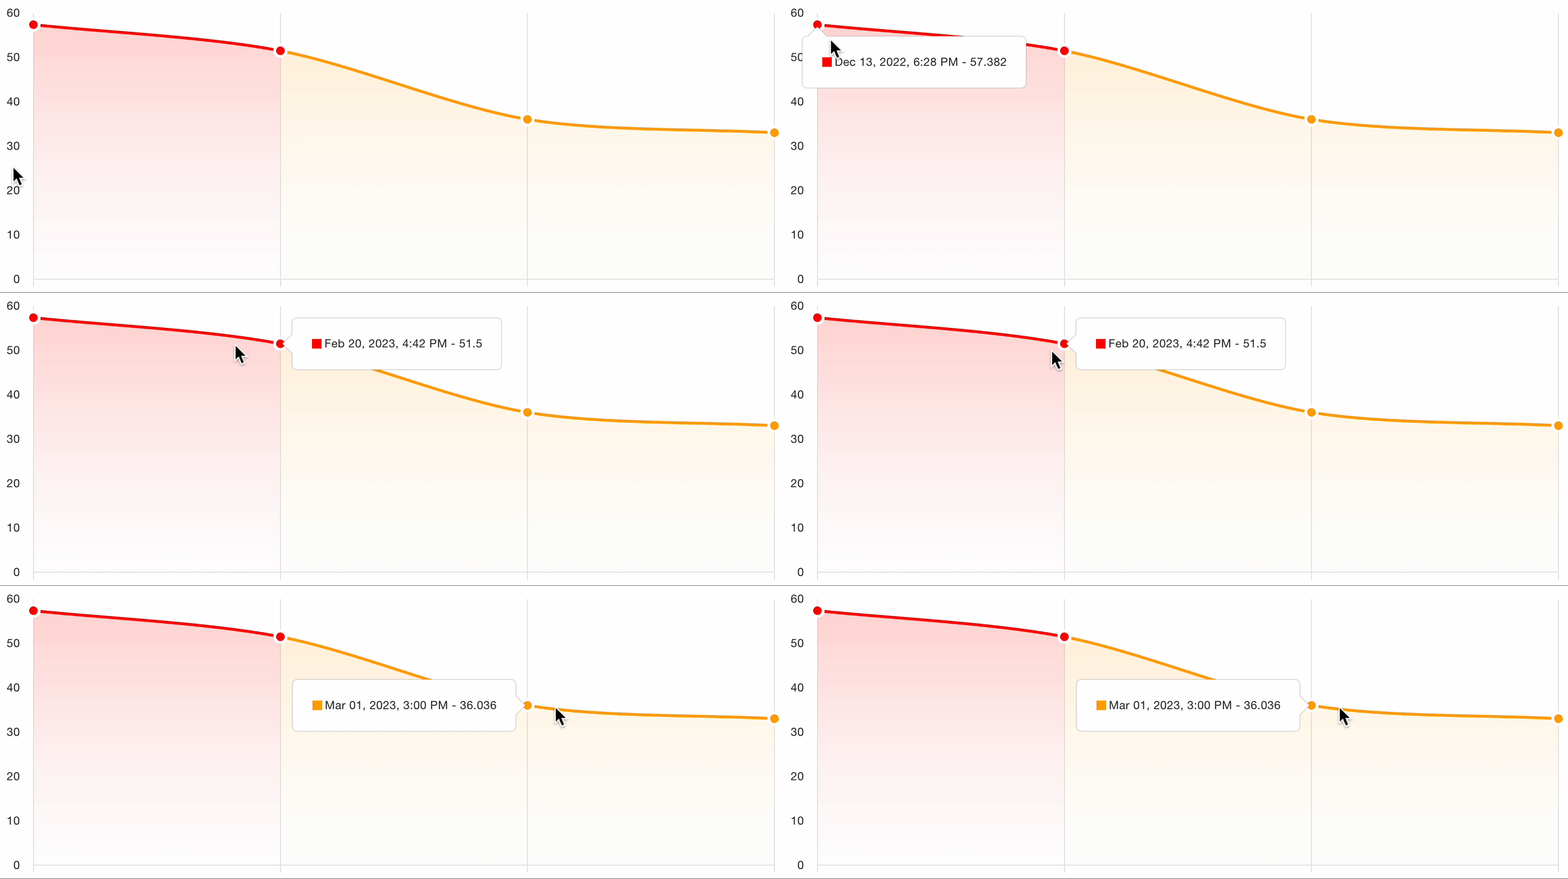
From the first follow-up visit onward the platform charts severity evolution for each patient:
- CLASI-A trajectory: absolute and percentage change from baseline, the usual basis for an activity response endpoint
- CLASI-D trajectory: accumulation across the study, which should stay flat under an effective therapy
- Target lesion trajectory: per-lesion area and per-sign values for each designated lesion
- Repigmentation: reduction in depigmented area from baseline, per lesion and per region
- Per-region and per-sign trends: which regions are responding and which sign is driving a change
Data export for EDC integration
Every assessment is structured for export to the sponsor's EDC. Per-sign values are exported alongside the assembled scores, so early-phase studies can analyse the continuous measures directly rather than only the CLASI items they feed.
| Field | Description | Format |
|---|---|---|
| Patient identifier | Study-specific pseudonymised ID | String |
| Visit and timestamp | Visit number and UTC timestamp of capture and processing | ISO 8601 |
| Anatomical region | Which of the 13 CLASI regions the image covers | Enum |
| Target lesion ID | Stable identifier for a designated target lesion, where used | String |
| Erythema intensity | Per region, on the mapped CLASI item scale | Integer |
| Scale and induration | Desquamation and induration intensity per region | Integer |
| Depigmentation extent | Affected area, relative or absolute (mm² with marker capture) | Float |
| Hair loss percentage | Proportion of the scalp region affected | Float |
| CLASI-A / CLASI-D | Assembled activity and damage scores per visit | Integer |
| Change from baseline | Absolute and percentage, per score and per target lesion | Float |
| DIQA score | Image quality per capture; sub-threshold images flagged | Float |
| Segmentation overlays | Annotated images and per-sign masks | PNG / JPEG |
Data transfers automatically via RESTful API, scheduled S3 export, or CSV/Excel. Legit.Health provides IQ/OQ documentation and data-mapping specifications for the major EDC platforms (Medidata Rave, Oracle InForm, Veeva Vault EDC).
AI visual outputs
Every report carries the segmentation overlays behind its numbers, so an investigator can verify each measurement against the photograph rather than take the score on trust. This matters most where a measurement can be right for the wrong reason, and it is the check the Limitations page recommends making part of any extent endpoint.
Active disease segmentation
The erythema, scale and induration models mark the inflamed plaque and its adherent scale.
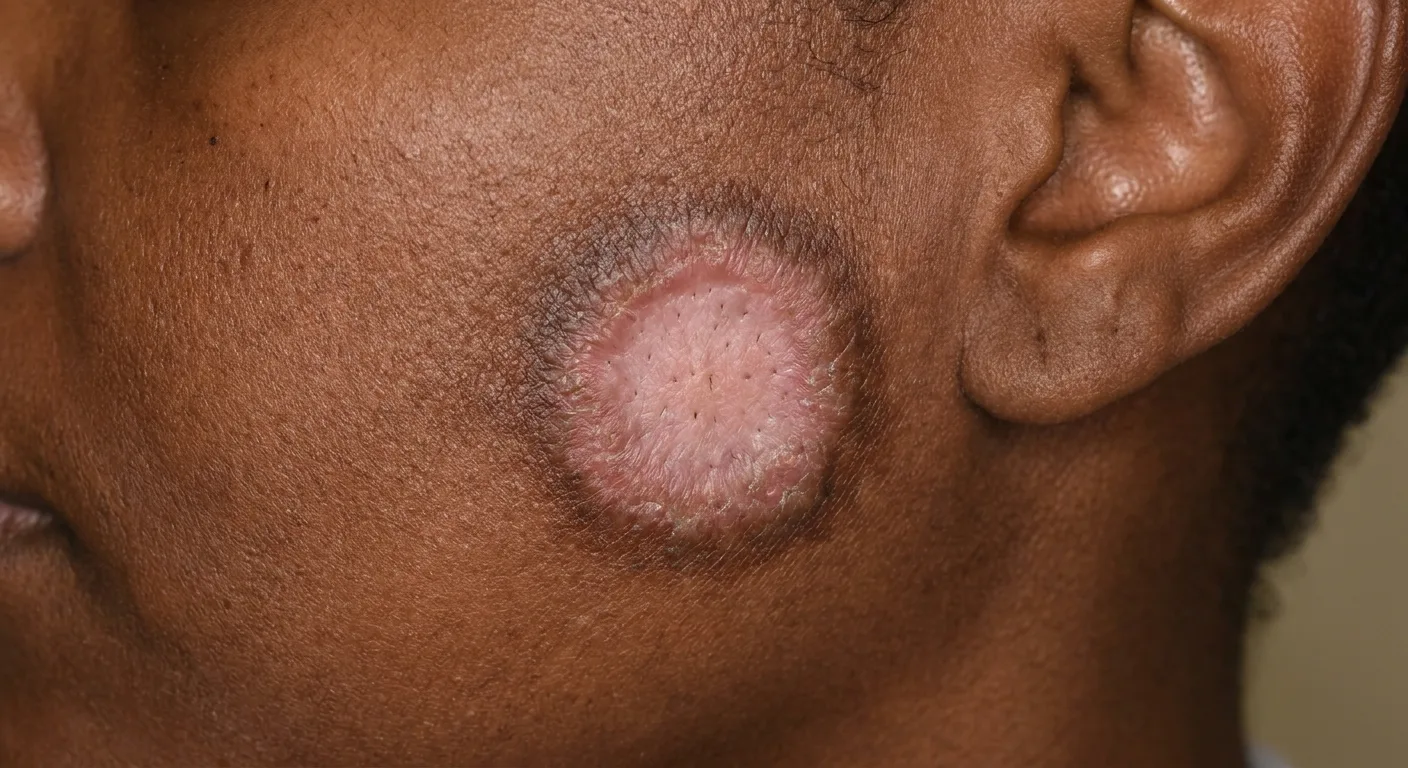
Input: single-region photograph
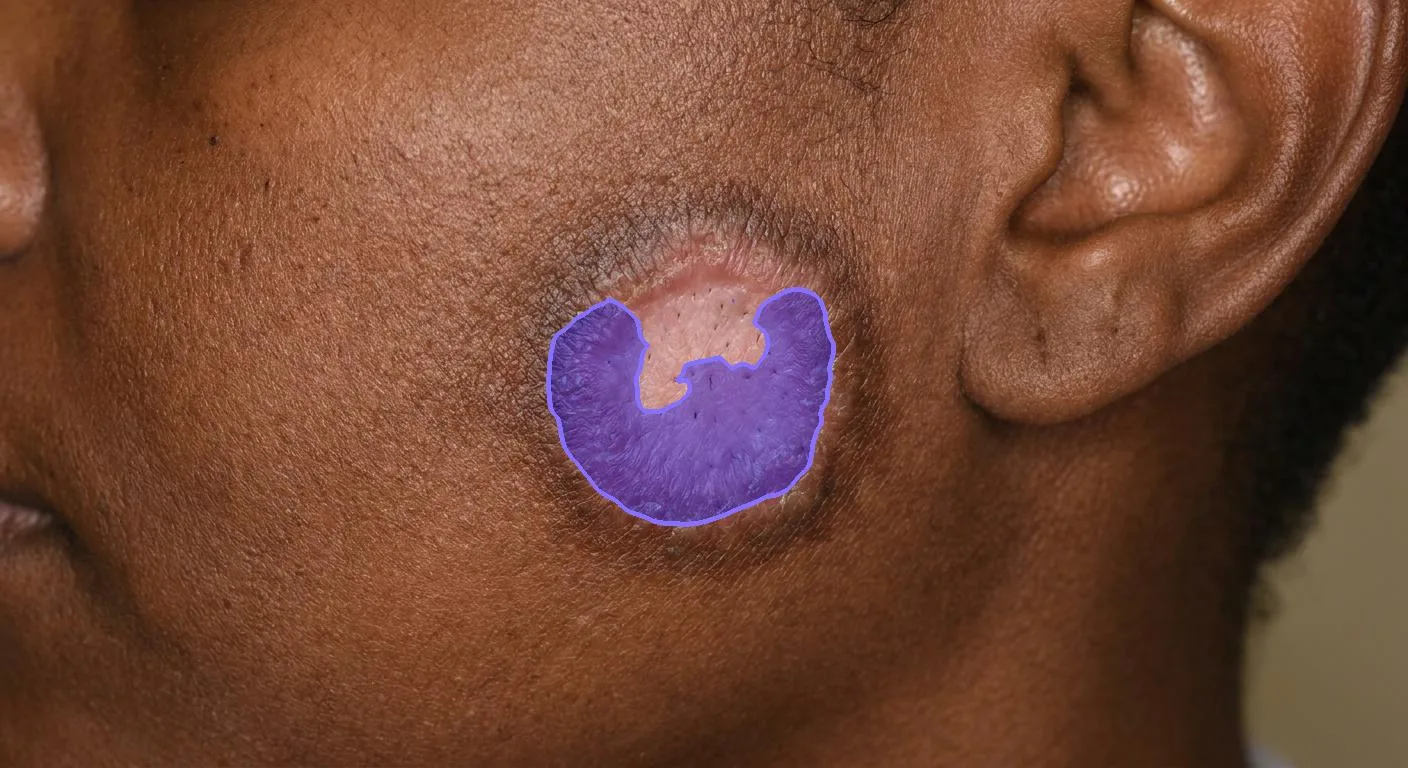
Output: active plaque segmented
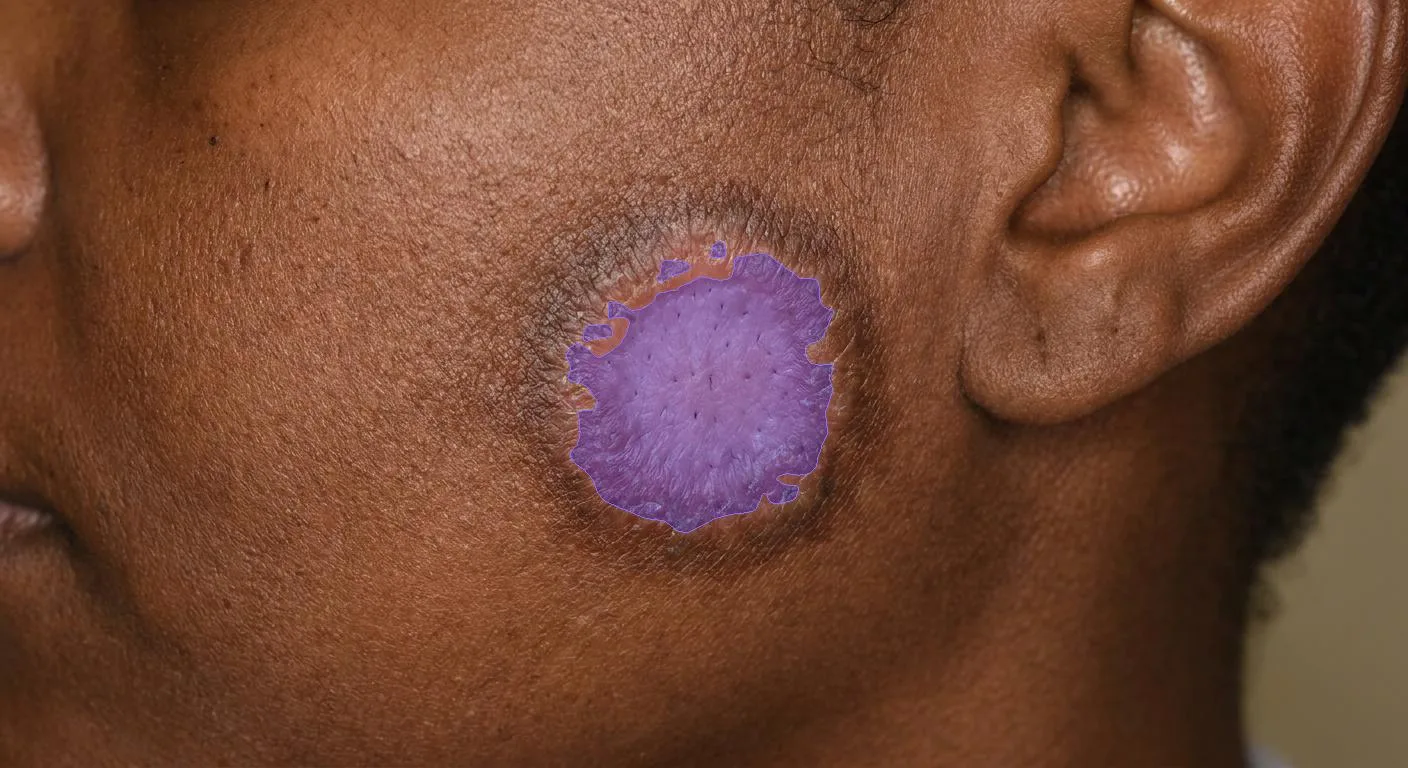
Depigmentation segmentation
The depigmentation model marks only the pigment-loss area, excluding the surrounding hyperpigmented border, which is what makes the continuous repigmentation measure above possible.
Input: single-region photograph
Output: depigmented area segmented
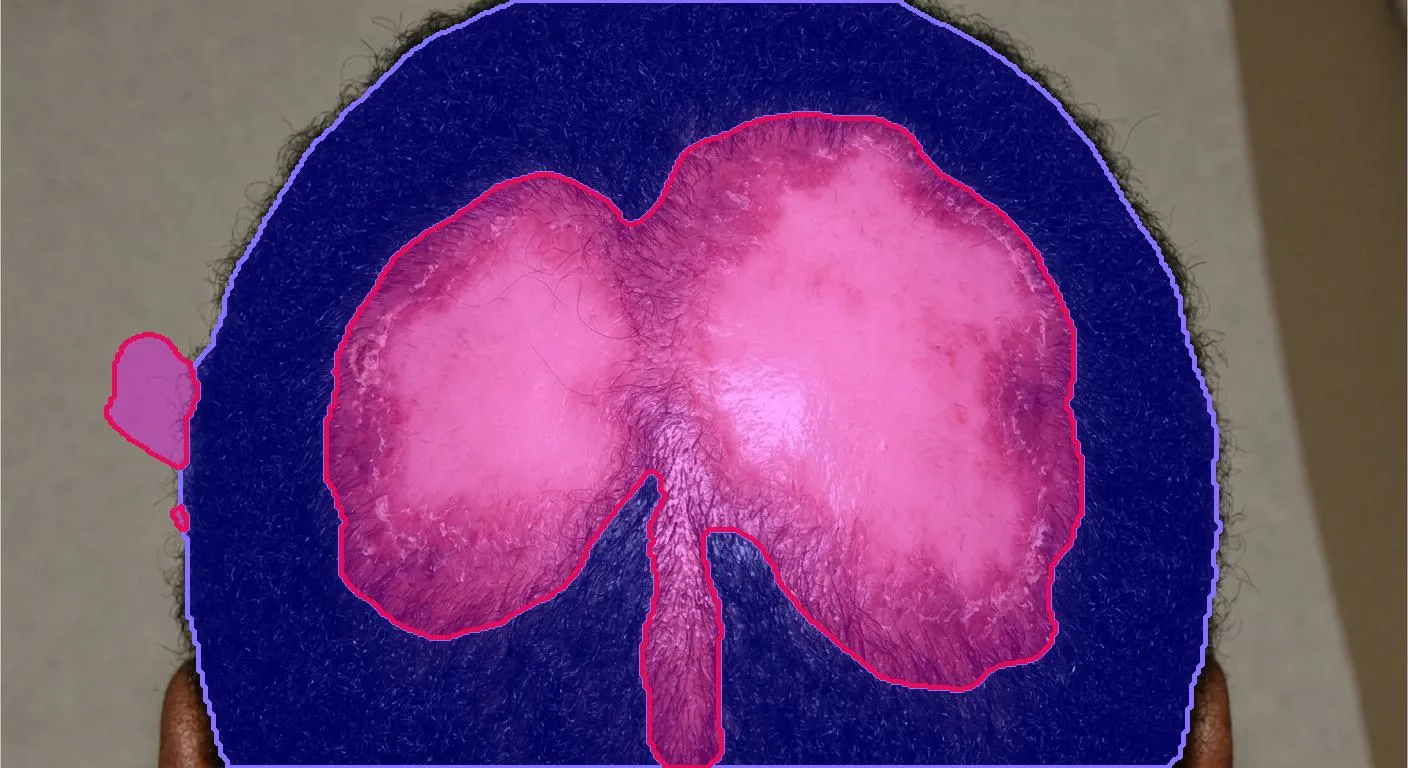
Scalp hair loss
On the scalp, the hair-loss model measures the affected proportion, feeding both the CLASI-A alopecia item and the CLASI-D scalp item.
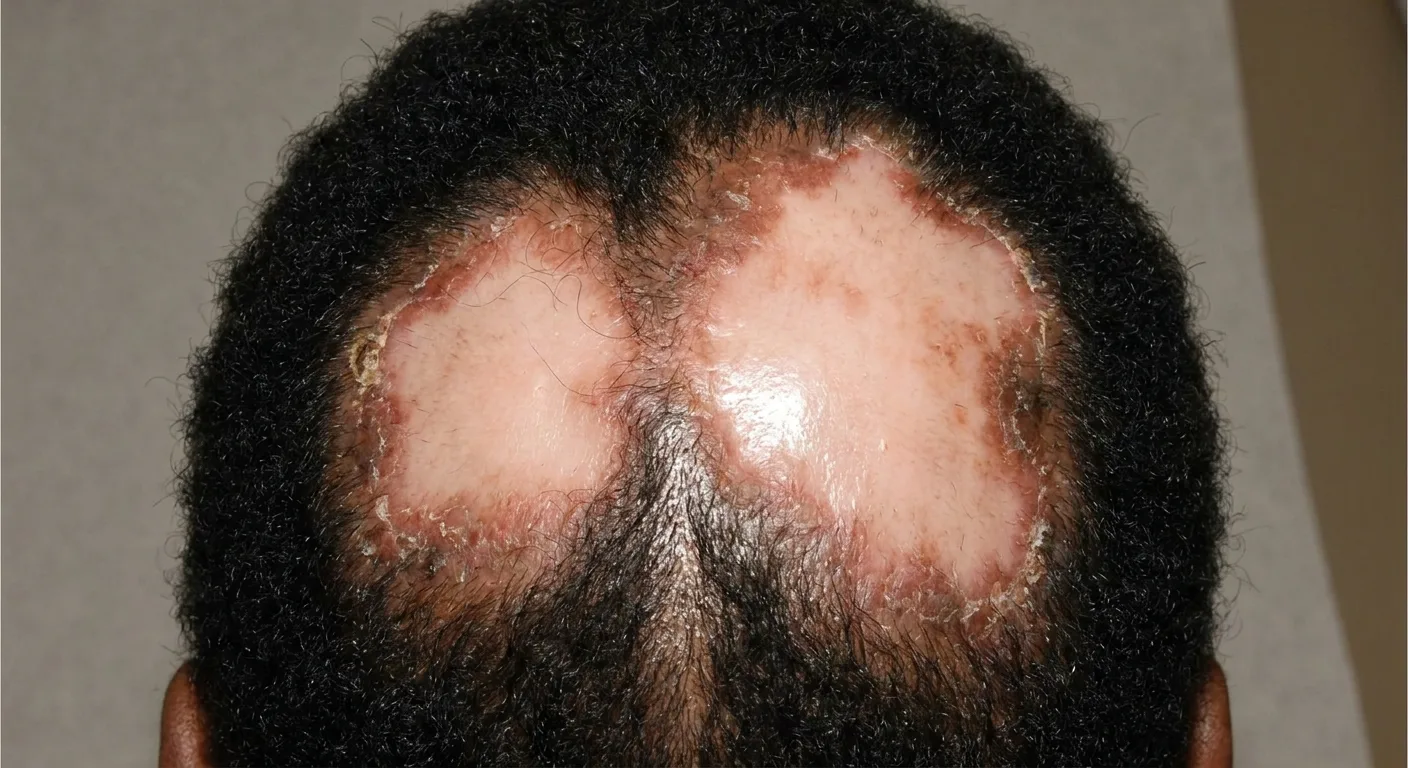
Input: scalp photograph
Output: hair loss segmented by area
Performance across skin phototypes
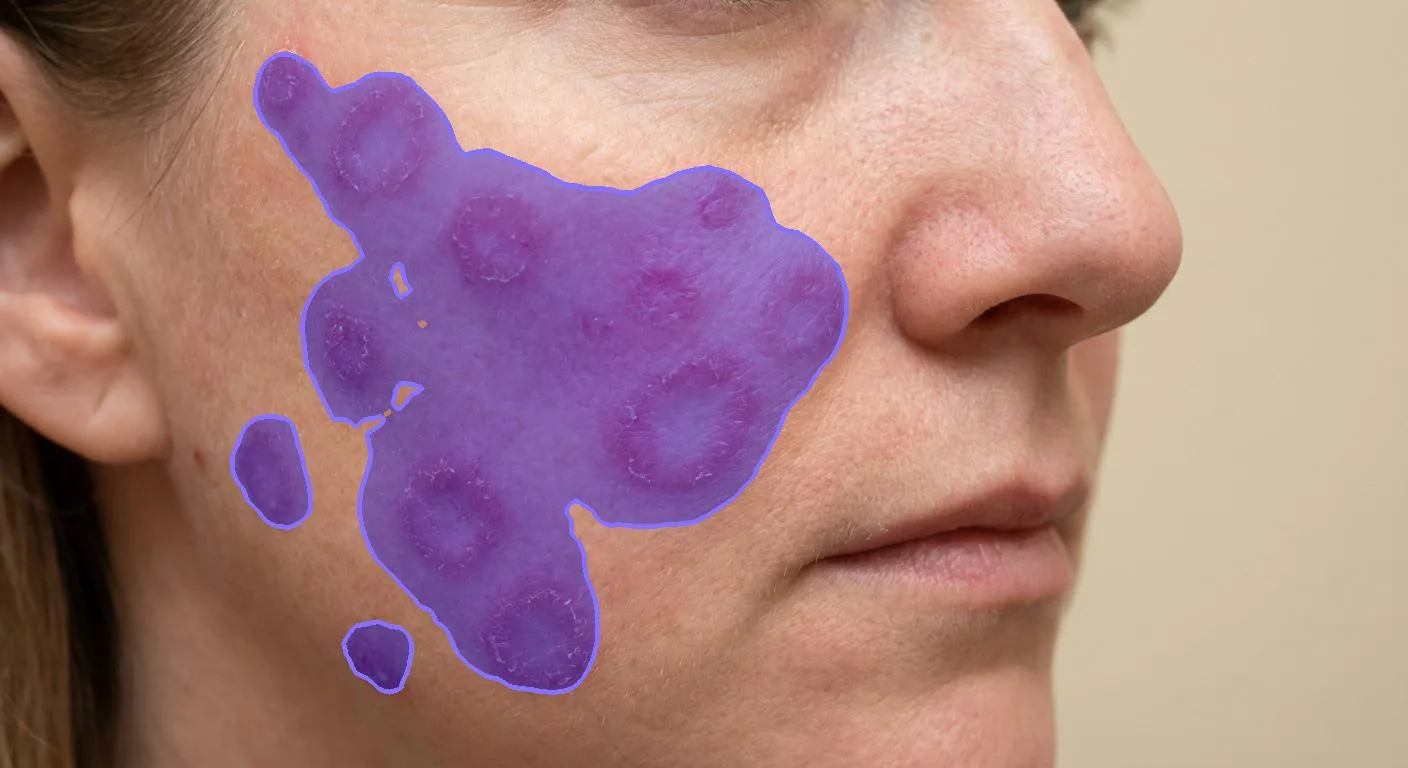
The signs behave differently across phototypes, and honestly so. Erythema is a high-contrast target on light skin and harder on dark; depigmentation is the reverse. The subacute example below is a light-phototype face where the erythema segmentation performs well.
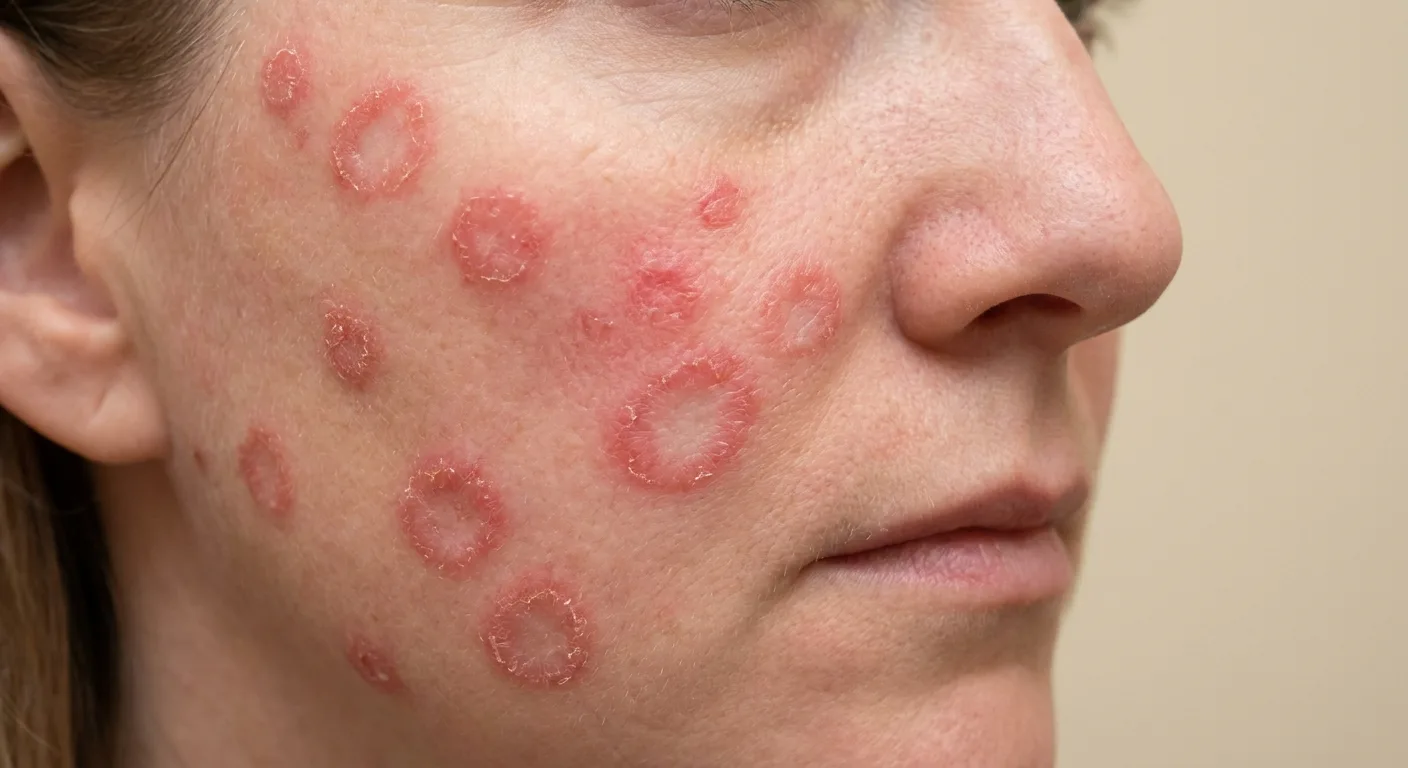
Input: subacute CLE, light phototype
Output: annular plaques segmented
The direction of that trade-off, and how to design around it, is set out on the Limitations page.
Reproducibility and validation status
The AI returns the identical value for the identical image, at every site, with no calibration drift and no inter-rater variability. That is the property that makes a multi-year CLASI-D trajectory comparable with its own baseline.
The measurements themselves are verified and validated as part of the CE-marked device, with cutaneous lupus inside its registered intended use. What an additional CLE-specific study would add is the agreement between the assembled CLASI and expert CLASI scoring in a CLE cohort; no such CLE-specific reliability statistic is quoted here until it is measured. The natural first step is a retrospective study against an existing CLE image set that already carries per-visit CLASI-A and CLASI-D scores, set out in full on the Clinical evidence page.